Strategy toolkits
Every framework and tool available for supporting strategic technology and innovation management has strengths and weaknesses, typically associated with what is explicitly included in the tool architecture / format, and what is not. All tools represent simplifications of reality, highlighting certain aspects over others. Naïve use of tools focuses only on the explicit, forgetting the implicit. For example, the well-known SWOT approach (strengths, weaknesses, opportunities and threats) is often used simply to capture these factors in a 2x2 table as a basis for reflection and discussion, which is useful but quite limiting as a strategic approach. For example, where is 'time' in SWOT, which is a fundamental dimension of strategy as a dynamic process? Considering SWOT in conjunction with the structured 'canvas' provided by the roadmap framework clarifies the context and time dimension in SWOT analyses, discussed in more detail here.
Given the holistic, flexible and systems nature of roadmap architecture, there is no inherent reason why any other relevant tool and its outputs cannot be integrated with or in roadmaps, as illustrated below for some related methods. No other tool has been identified that shares the integrative capabilities that roadmapping provides, which can address the very common problem of conflicting and poorly integrated strategy and innovation management tools. The simplest toolkit configuration is to use roadmapping as an integrating knowledge hub, although other arrangements are possible. With each tool in the set aligned to the roadmap architecture the set scales with the roadmap, to ensure consistency of focus, scope, granularity and aggregation.
Roadmapping can support integration of strategy, process and tools
Over the past 50 years strategy and innovation management tools and frameworks have proliferated, mostly developed by consultants and academics. The choice can be bewildering for managers confronted with a practical challenge. The 2013 book 'Key strategy tools: the 80+ tools for every manager to build a winning strategy' is indicative of this challenge. Although a useful catalogue, it is difficult to judge which particular tools in what combination to select, and how they can be customised to work together to address the issues at hand. And this is just the tip of the iceberg - a study in 2000 (Phaal et al.) identified more than 850 matrix tools (ubiquitous ‘2x2’ type, and grids), with dozens more being developed each year, adding to the challenge.
A pragmatic focus on tried and tested industry-proven tools provides a feasible solution to the problem of tool proliferation, as the generic forms can be configured to accommodate recent (and older) approaches and frameworks, with the confidence that one is building on approaches that have been demonstrated to work. Through empirical investigation, three generic tool types have been found to function well together for general application to strategy and innovation management:

Three well-proven tools form the basis of a scalable toolkit platform for strategy and innovation management. These methods have proven themselves in industry for decades, propagating through a process of speciation. Consolidation to their generic forms as a toolkit platform provides a feasible solution to the proliferation challenge. The origins of roadmapping are obscure, but early examples of roadmapping have recently been identified in US high tech sectors, such as aerospace, semiconductors, energy systems, defence (Kerr & Phaal, 2022).
So, rather than 80 or more tools to deal with, only 3 are required as a starting point, as the basis for a toolkit platform, with a modular approach enabling other tools to be incorporated as required. The challenge is that the generic forms of these tools are quite abstract and they must be combined and configured to purpose, which requires considerable experience to do reliably with confidence.
The good news is that it's possible to test-drive new tools rapidly, with the first iterations useful for assessing utility of the methods, and how they need to be adapted to fit the context. For the first pilot, Tom Kappel, who worked with Richard Albright to implement roadmapping in Lucent Technologies in the late 1990s, recommended that a safe environment be chosen to pilot the approach: "it's like carpet cleaner - test it under the sofa, not in the middle of the living room" - roadmapping workshops can be high profile affairs, with failure not an option.
The three core tools in the toolkit platform are presented chronologically in terms of their origination as management frameworks and tools:
1) Linking grids
The linked grid is a widely used but generally unrecognised class of tool. The key reference point (instance) is quality function deployment (QFD), a Japanese quality method, linking customer to technical attributes for process and product design. QFD has been extended in various ways, and a related approach that emerged later is the Hoshin Kanri 'X-matrix' that supports vertical and horizontal alignment of strategy, purpose and action in large organisations (not widely deployed outside of Japan). The design structure matrix (DSM) is another notable instance of this class of tool, as is the cause and effect matrix from lean / six-sigma (related to Ishikawa diagrams).
The example that can be most readily related to roadmapping is shown below, from PA Consulting, which links technologies to products and markets - 'technology push' (and vice versa - 'market pull'), matching the three broad 'why, what and how' layers of roadmaps. Time is not an explicit dimension for linked grids, so this one is extended to include (future) potential technologies, products and markets. This simple tool is very powerful and flexible, with strong analytical capability (i.e. spreadsheets), can blend quantitative and qualitative information, and is very useful for mapping and analysing relationships - e.g. synergies. However, the structure and format can be a bit daunting for large systems, particularly if used as a primary lens (e.g. as a workshop template).
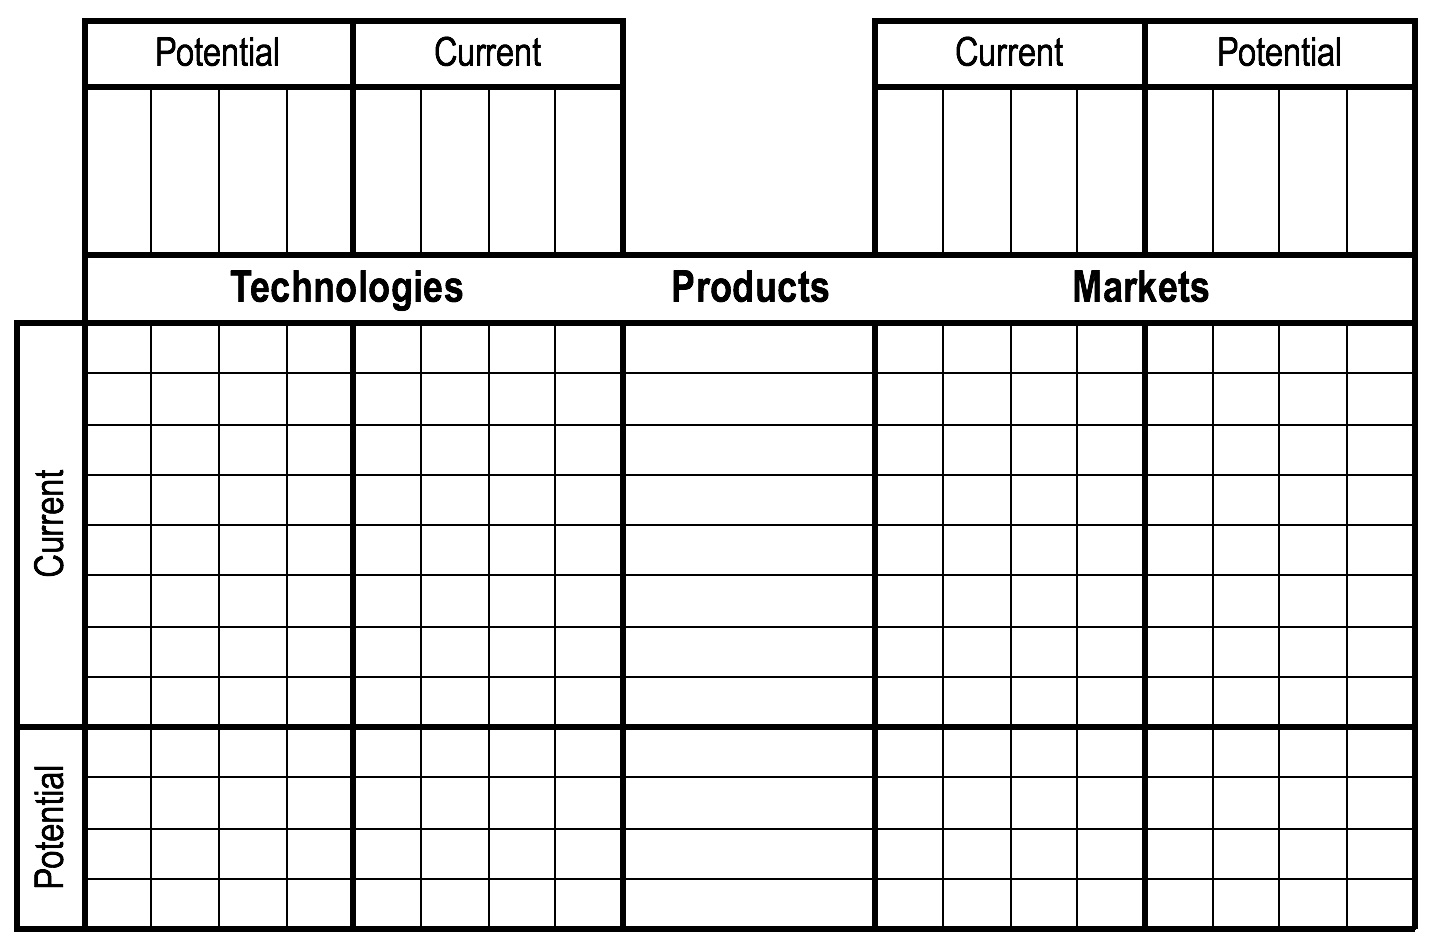
'Technology-Product-Market (TMP) Diagnostic, Lindsay (2000)
One of the most interesting examples of this class of tool is shown below, from Gideon de Wet, as a practice-oriented contribution to the 1996 IAMOT conference and not widely disseminated (similarly his interesting 'space map' approach for technology management and audits). De Wet demonstrates the flexibility of the tool, which is very extensible. With the core linking grids 'welded' to the roadmap architecture, as illustrated above, combined with the flexibility and extensibility of the linking grids, the methods work and scale together. Roadmaps are rather weak with regard to analysis capability, and linking grids are weak with regard to time and narrative. so the two complement each other well.

'Technology Income Statement', de Wet (1996)
A core set of interlinking grids can be defined with reference to roadmap architecture (which governs scaling of toolkits), as illustrated below, to which other perspectives can be readily added. This ensures a perfect fit between the two tools, and enables dependencies between layers of the roadmaps to be clearly mapped, providing analytical support.

Interlinked grids in relation to roadmap architecture, in three dimensions, supporting: functional alignment, hierarchical integration, and temporal synchronisation (cross-impact grids not shown)
2) Portfolio matrices
The well-known 2x2 matrix diagram or 'bubble chart' is widely associated with portfolio management, and these are very useful tools to support strategic analysis, prioritise options and make decisions throughout the roadmapping process. There are many such matrices in the literature, of varying provenance, prevalence, utility and quality. Six noteworthy examples are shown below. The original Boston Consulting Group product portfolio (market growth vs share) emerged in the early 1970s, preceded by the Ansoff 2x2 matrix in the late 1950s (current/new products vs markets).
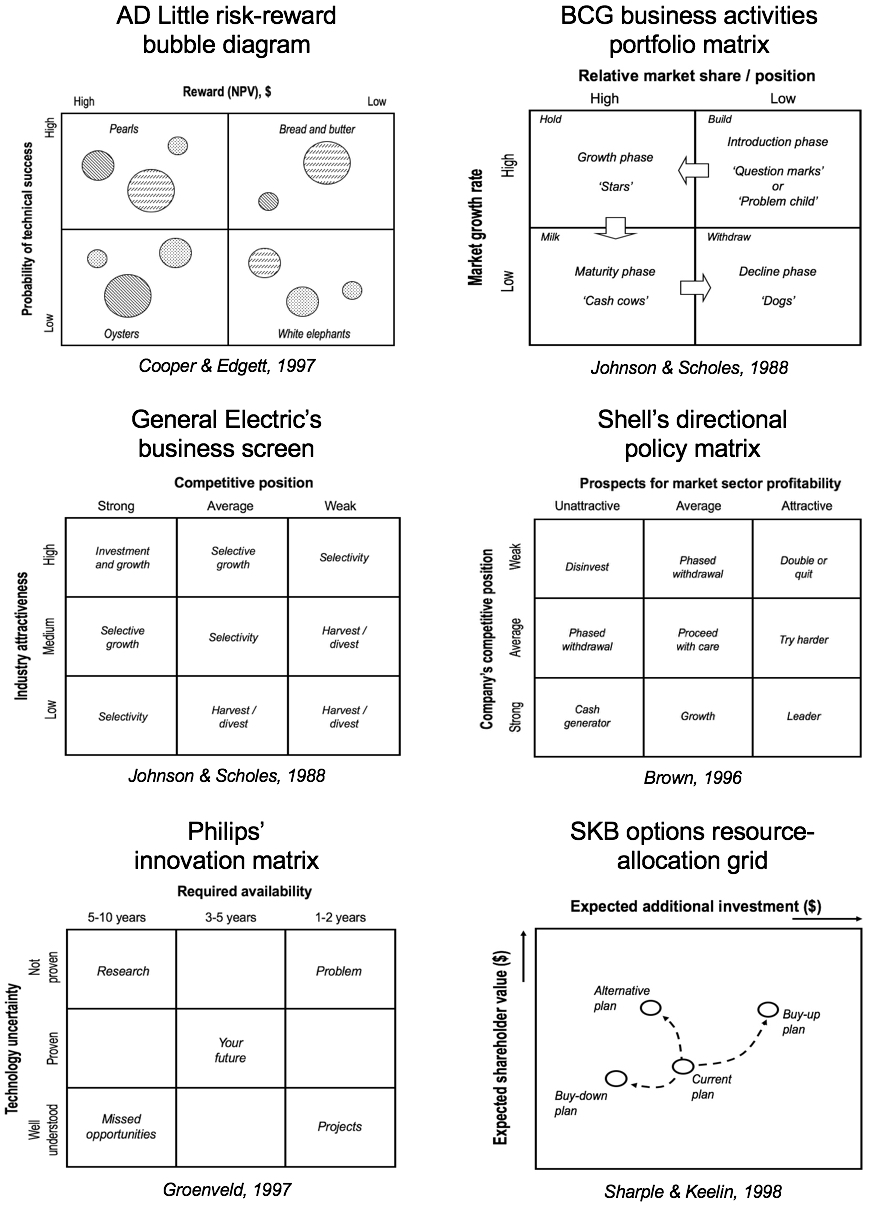
A selection of portfolio matrix tools
In response to the proliferation of strategy tools since the 1960s, in 2015 the Boston Consulting Group proposed a new matrix that positions tools in terms of three dimensions: predictability (is it forecastable?), malleability (can it be shaped?) and harshness (is it survivable?). This defines five distinct strategy environments: classical (predicable, but not changeable), adaptive (unpredictable, but not changeable), visionary (predictable and changeable), shaping (unpredictable but changeable) and renewal (resource constrained). This is a useful contribution, although the manager is still left with many tools and frameworks to consider in each category, with blended options possible. A tools-oriented perspective provides a possible solution, in terms of the scalable toolkit platform to build on that can apply to all strategy environments identified by BCG.
Examination of about 40 business, product and technology portfolio selection tools revealed that 60% of these collapse into one generic matrix form comprising two orthogonal dimensions: Opportunity x Feasibility - see below. Opportunity represents the value, impact or other measure of worth ('how big is the pie?'), whilst Feasibility represents the ability or likelihood of being able to gain that worth ('can I get that pie?'). The factors that are used to assess Opportunity and Feasibility typically need to be customised to context (a revealing and useful process in itself), with the literature providing examples as a starting point for some applications - e.g. near market commercial projects (Mitchell et al., 2014), vs early stage technological innovation.

Generic Opportunity-Feasibility matrix for project selection (Mitchell et al., 2014)
A 2018 working paper describes the project selection approach, which includes some novel features: treatment of uncertainty as ranges on all factors, with the min-min and max-max plotted on the chart (risk that is not associated with these uncertainties is treated separately - listed, with mitigation actions); and the use of scaling statements for assessing the merits of projects, which eliminates the need for (sometimes arbitrary) weightings.
The OxF matrix is the core tool of this type in the toolkit platform, with many other 2x2 matrices falling into place around it, in a kind of decision-making 'filter stack'. For example, the Ansoff matrix can be used to 'pre-condition' project types - to separate them out into different types in terms of the degree of innovation involved (as strategic 'buckets'). This is important, as the criteria for selection will typically be different, and an appropriate configuration of the OxF matrix (and process) would be needed for each. After projects have been prioritised, other decision factors become relevant, such as portfolio 'balance' (or rather, tension / trade-offs), make vs buy, and so on, where other 2x2 decision-support matrices are helpful. A masters project report on portfolio balancing can be downloaded here.
The data relationships between portfolio matrices and roadmaps are not as clear-cut as with the linking grid tool, and in general these two tools are not used closely together in corporations for various reasons. One example from Lucent Technologies in the 1990s provides an alignment clue (Albright and Kappel, 2003), where they show a roadmap with two columns inserted to the right with data from a portfolio 2x2 (competitiveness vs importance, often associated with make-buy decisions). Linking common data sources / structures / elements to the architecture of the roadmap ensures that both tools work in harmony, and scale together, along with the linking grids.
3) Roadmaps, and toolkits
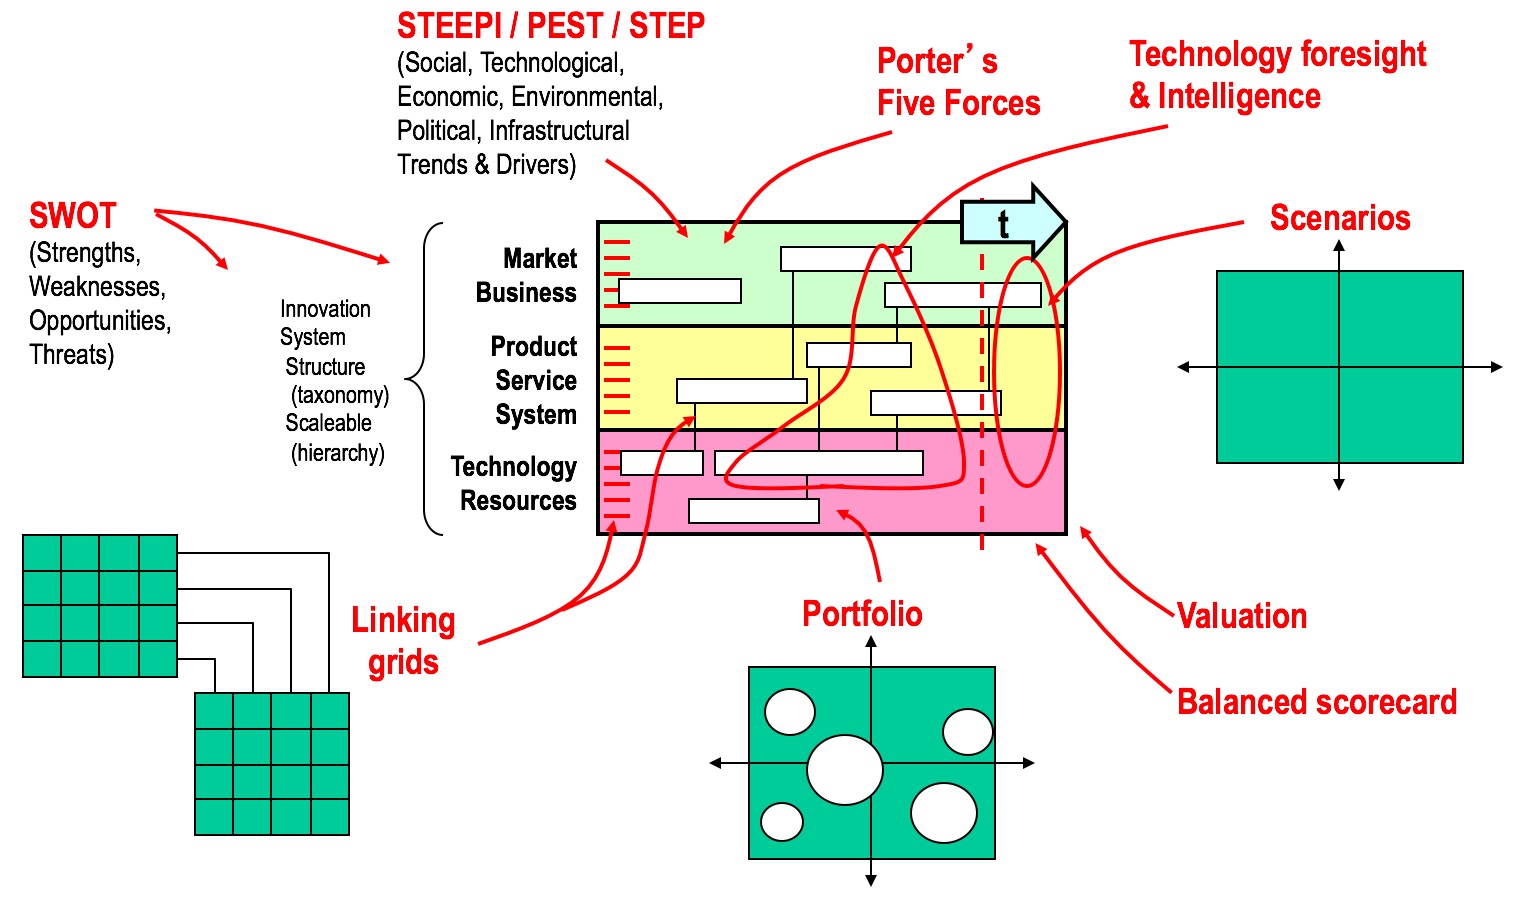
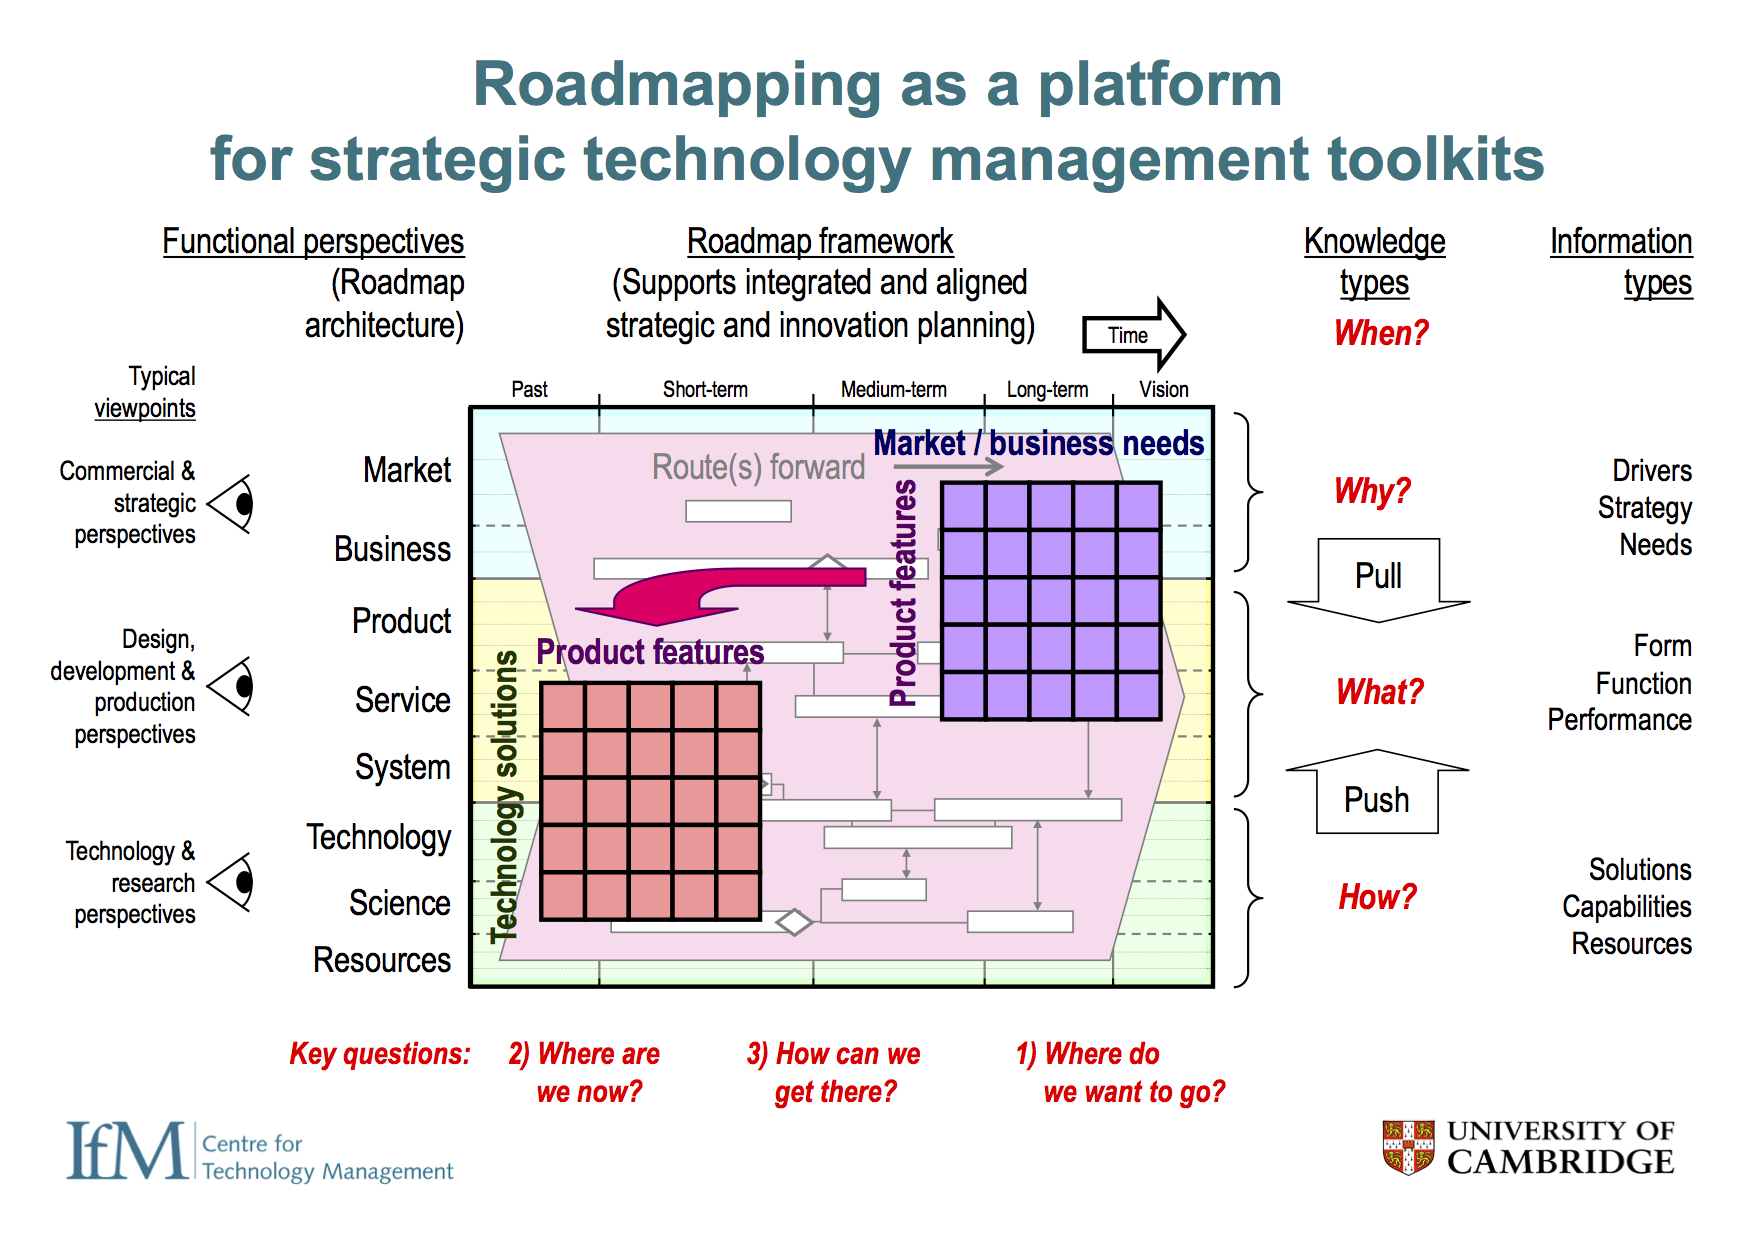
As elaborated here, a key feature of the time- and systems-based roadmapping architectural framework is its holistic and flexible structure, and its integrative abilities. As such it forms the natural central hub for strategy and innovation management toolkits, with scalability enabling the same generic toolset to be used at different levels of hierarchy - for example, to develop coherent strategy at corporate, business unit and product levels, and to add other tools as required in a modular fashion, as illustrated below. Many of these other tools are essentially variants of the more general forms established, with a degree of coherence emerging with regard to the plethora of available tools, which can be deployed via these general forms.

Corporate innovation strategy toolkit (Phaal et al., 2012)
So, in summary, with three generic tools you can get quite far with most strategic challenges. Even with these three tools, at two levels (so that a portfolio view can be established), there are many possible ways to combine them. Adding many more tools increases complexity exponentially, becoming rapidly unmanageable.
The vision is for a compact general purpose adjustable visual toolkit, that with proficiency in its configuration can provide the basis for coherent strategic technology and innovation management support.
A lean / agile 'fast-start' approach is recommended initially, regardless of the size of the apparent challenge when implementing new tools, with early iterations helping with scoping and design, as a learning process. The process and system can be scaled up as it demonstrates value.
A set of experimental templates is available here, which illustrate how the three core tools align ('STIM toolkit').
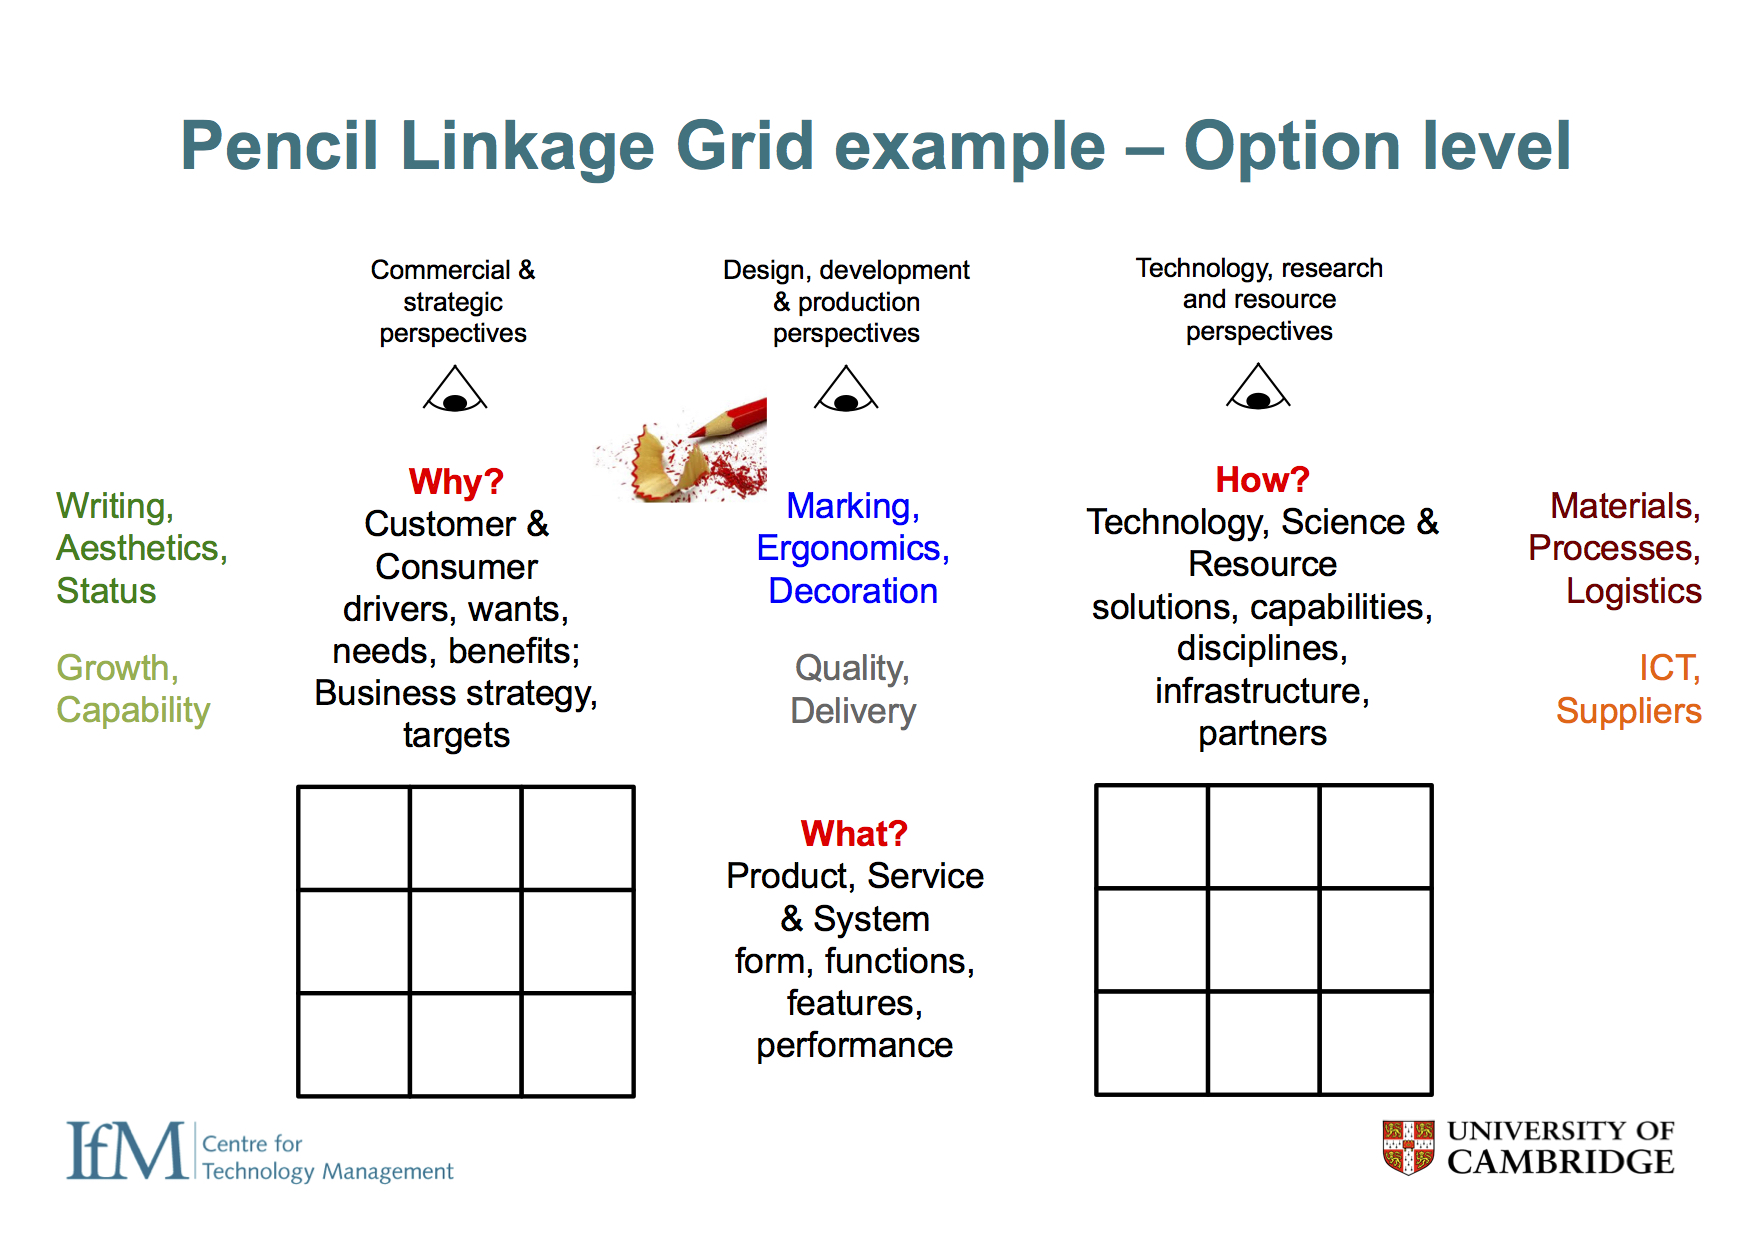
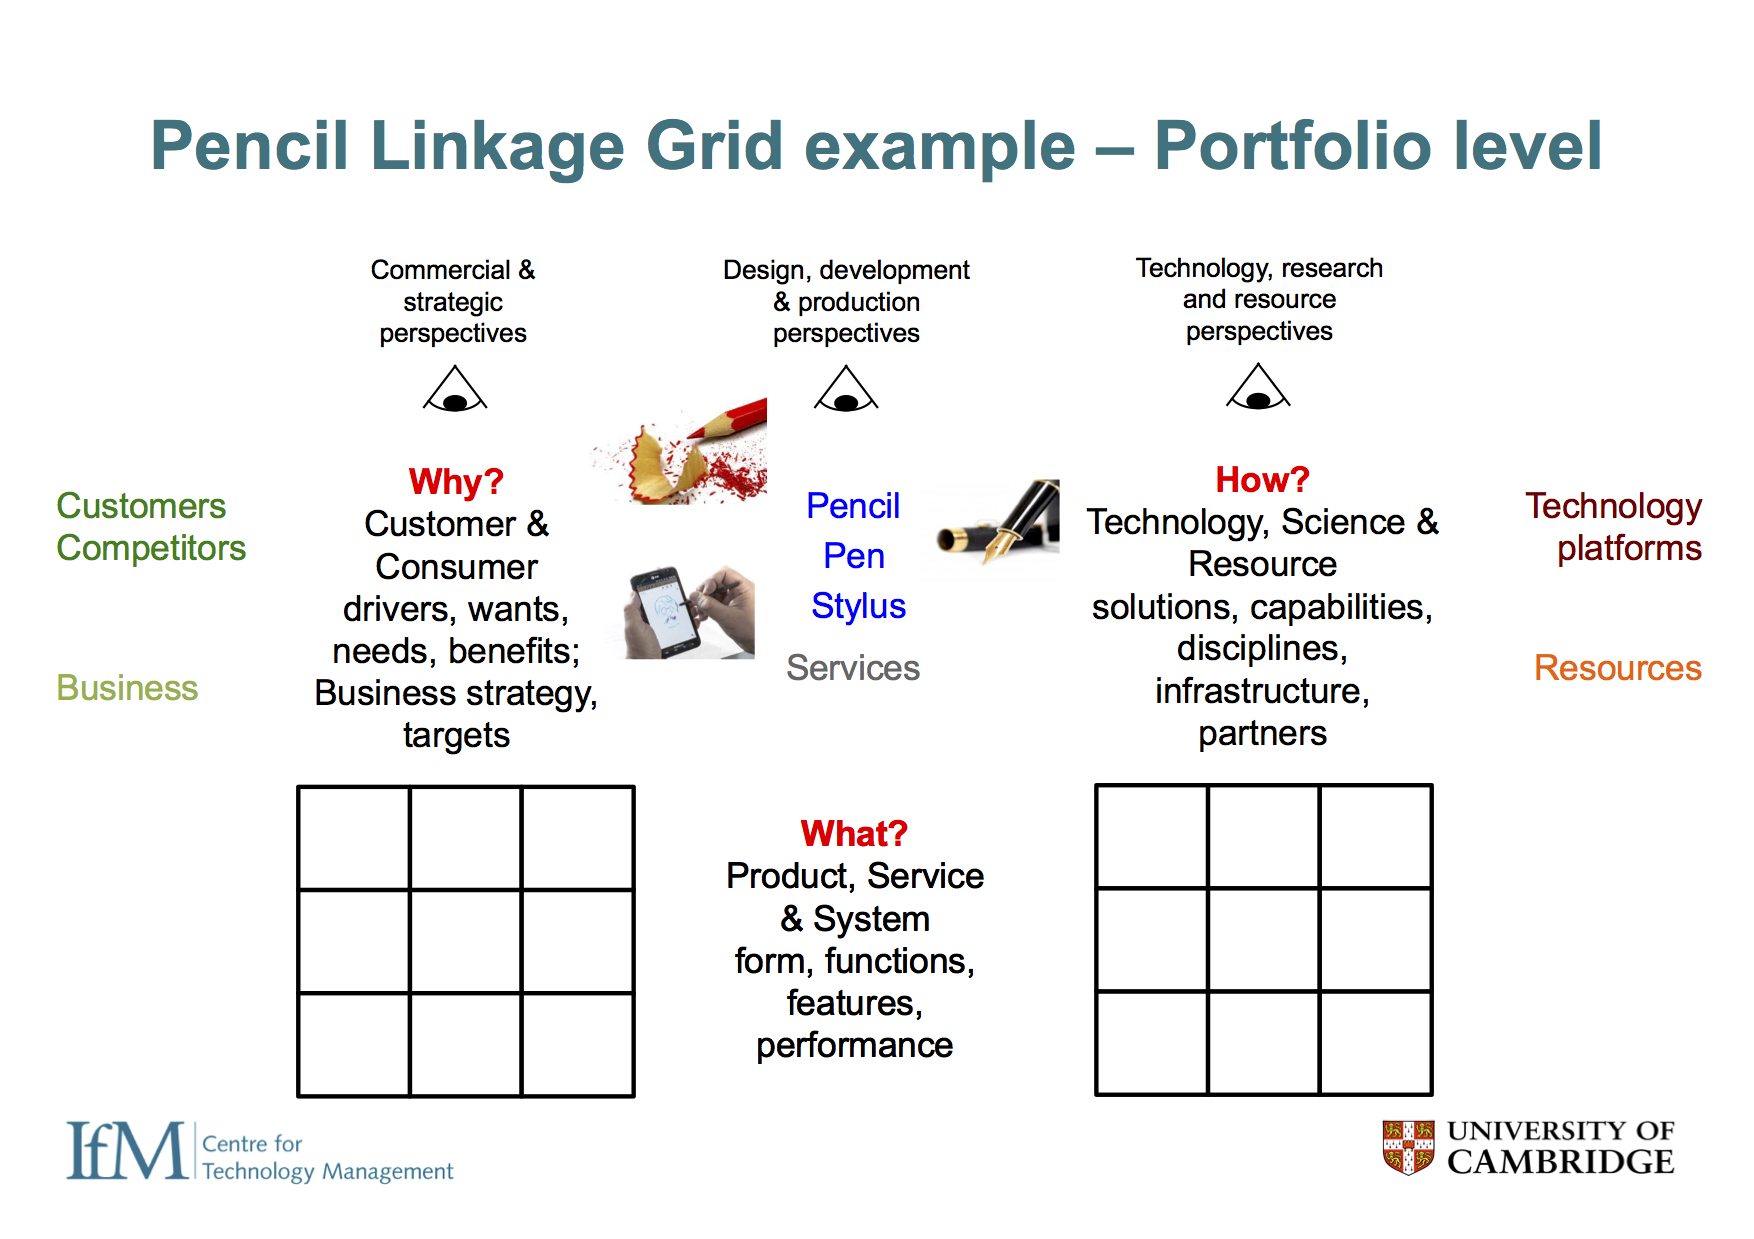
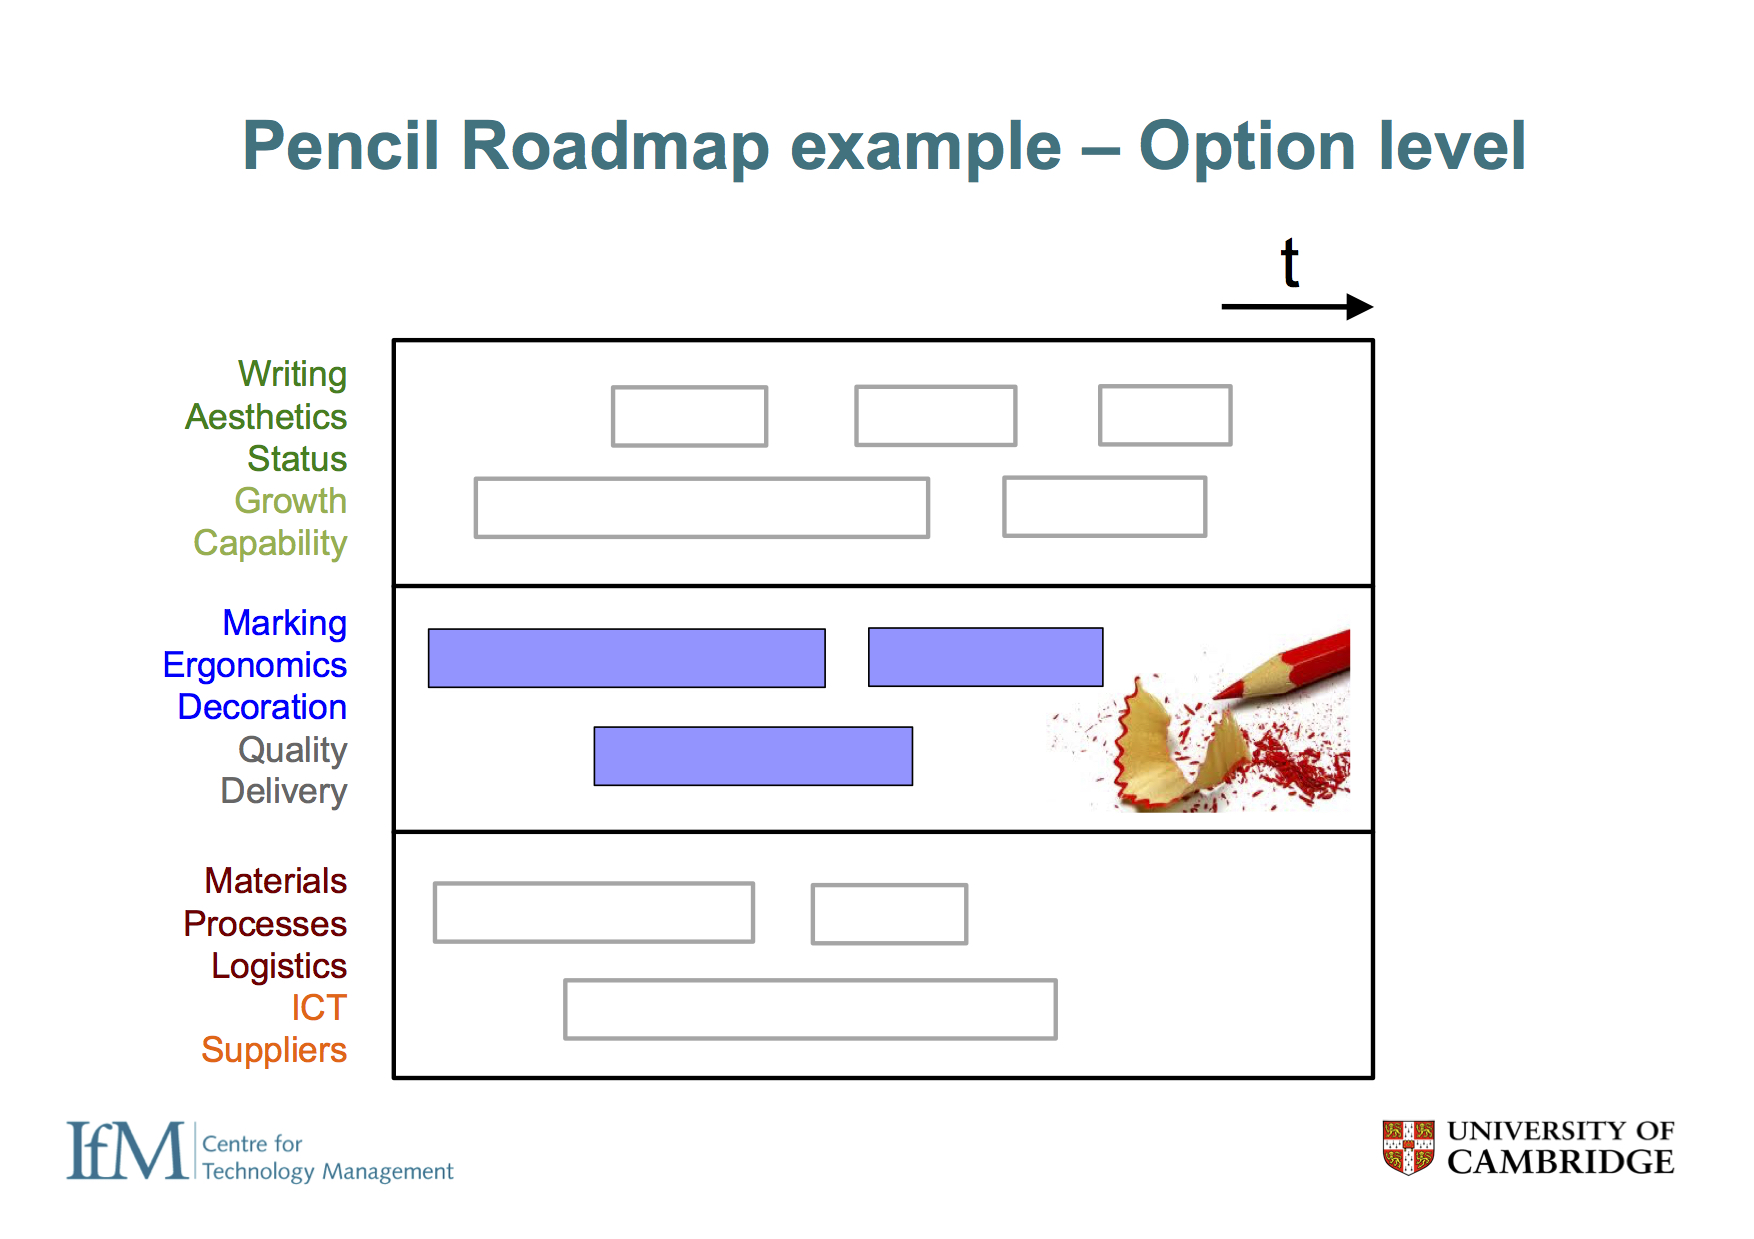
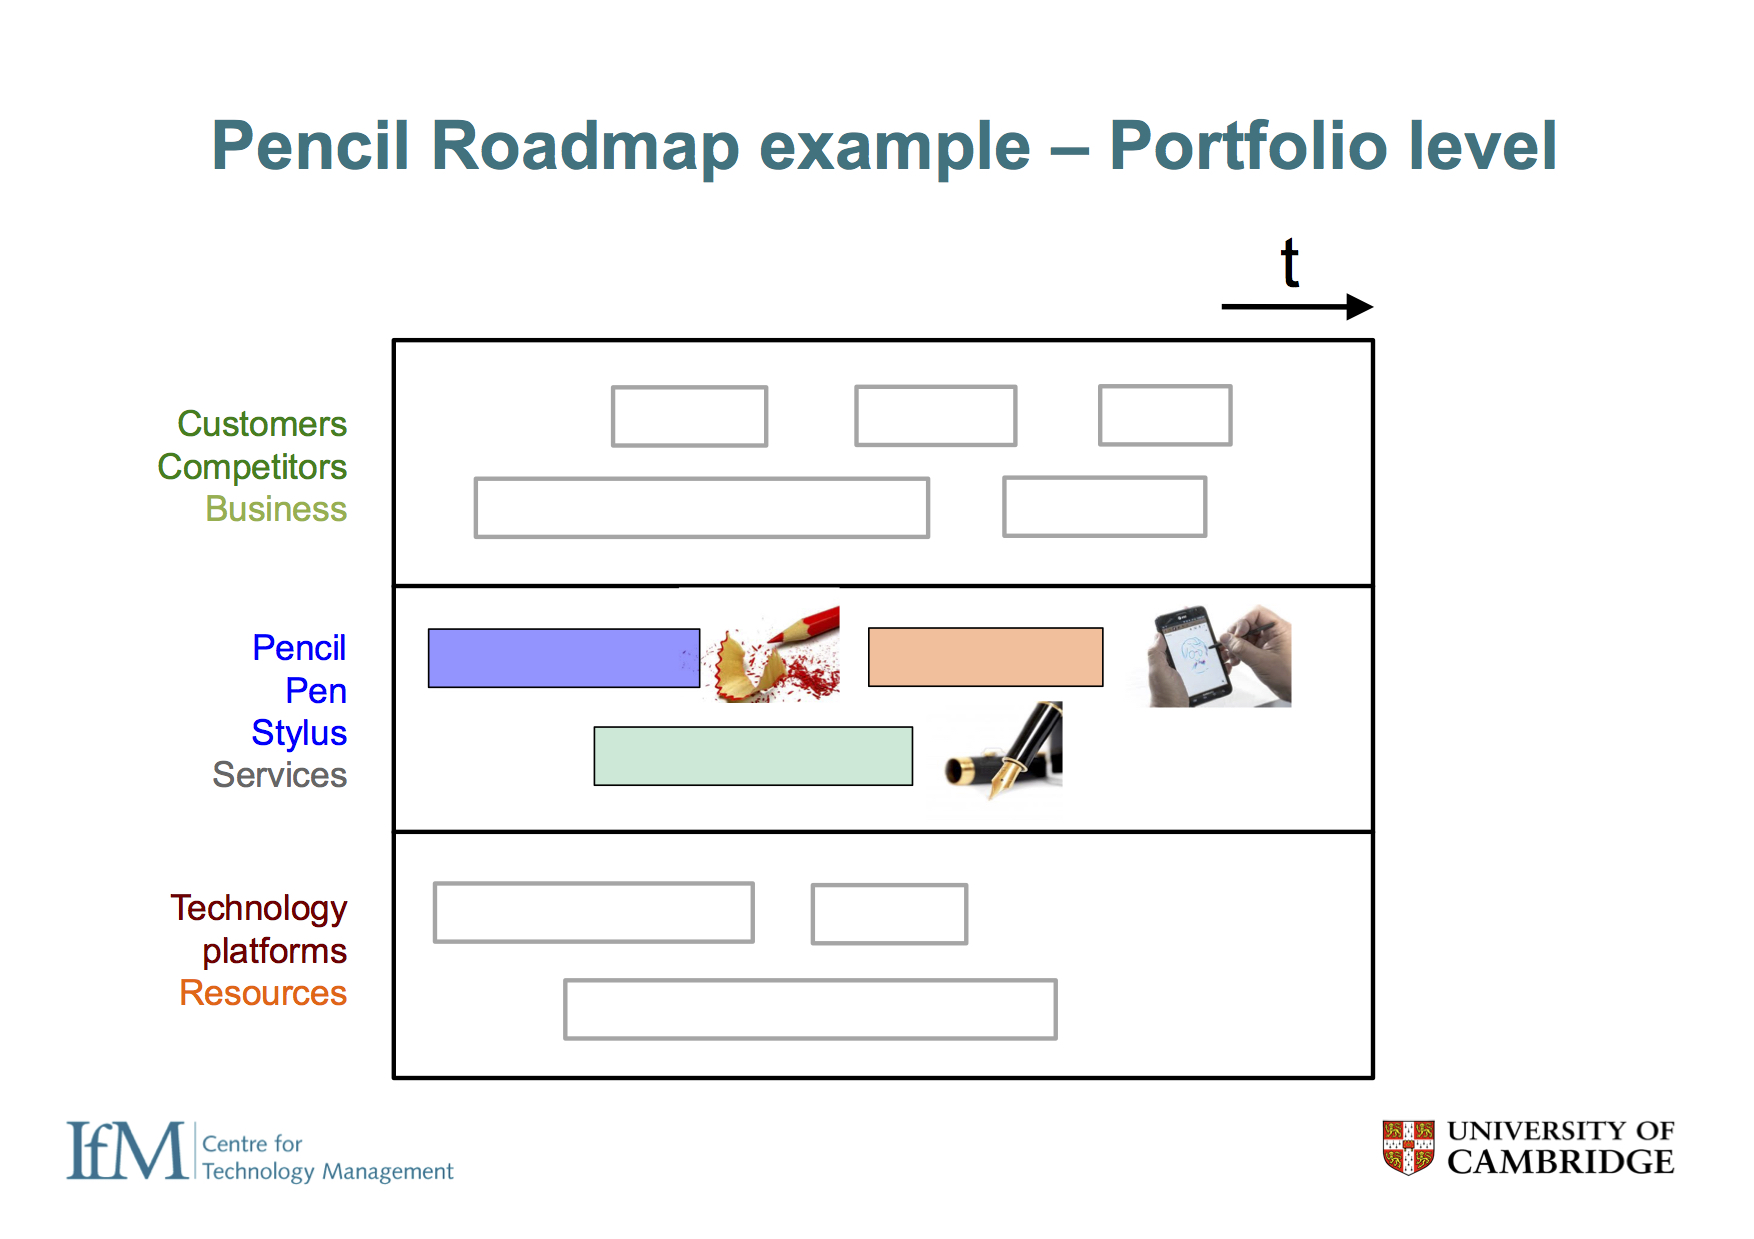
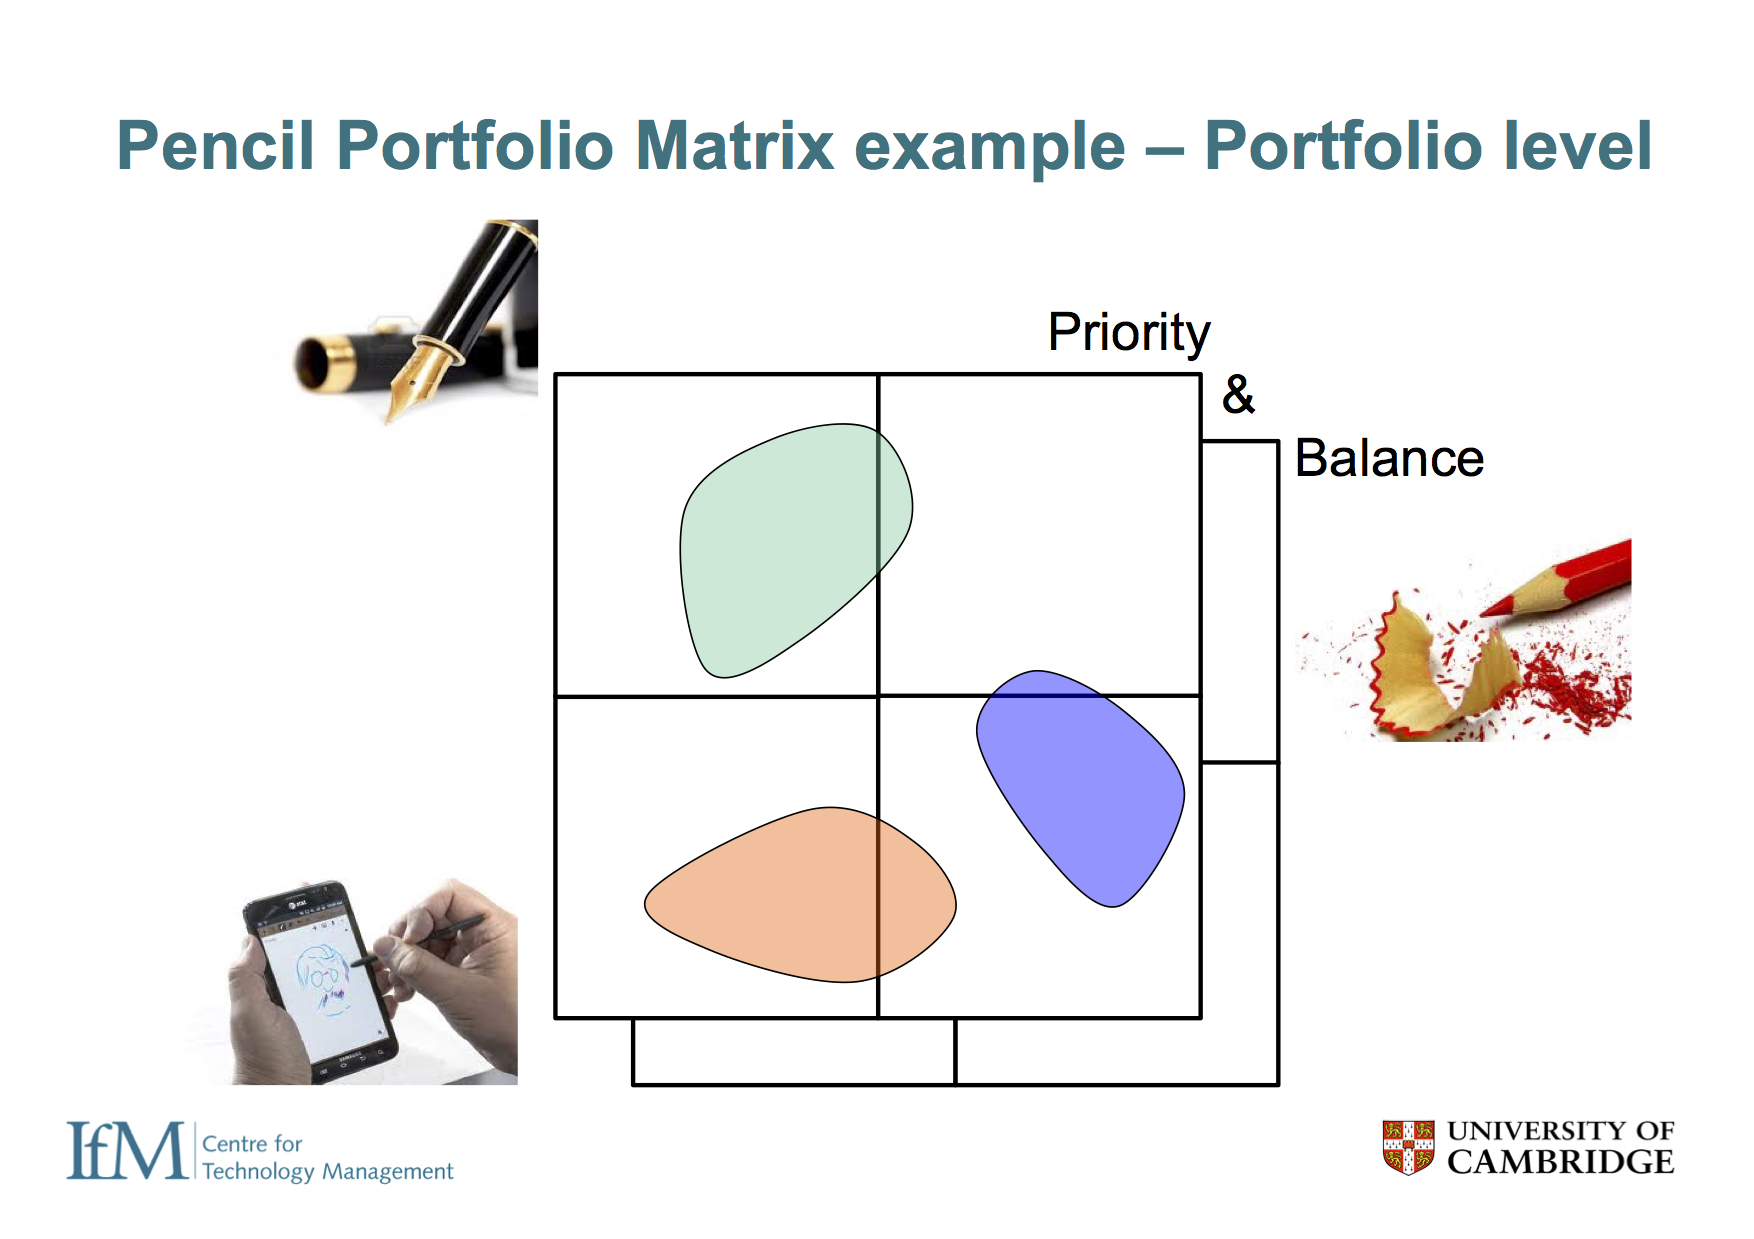
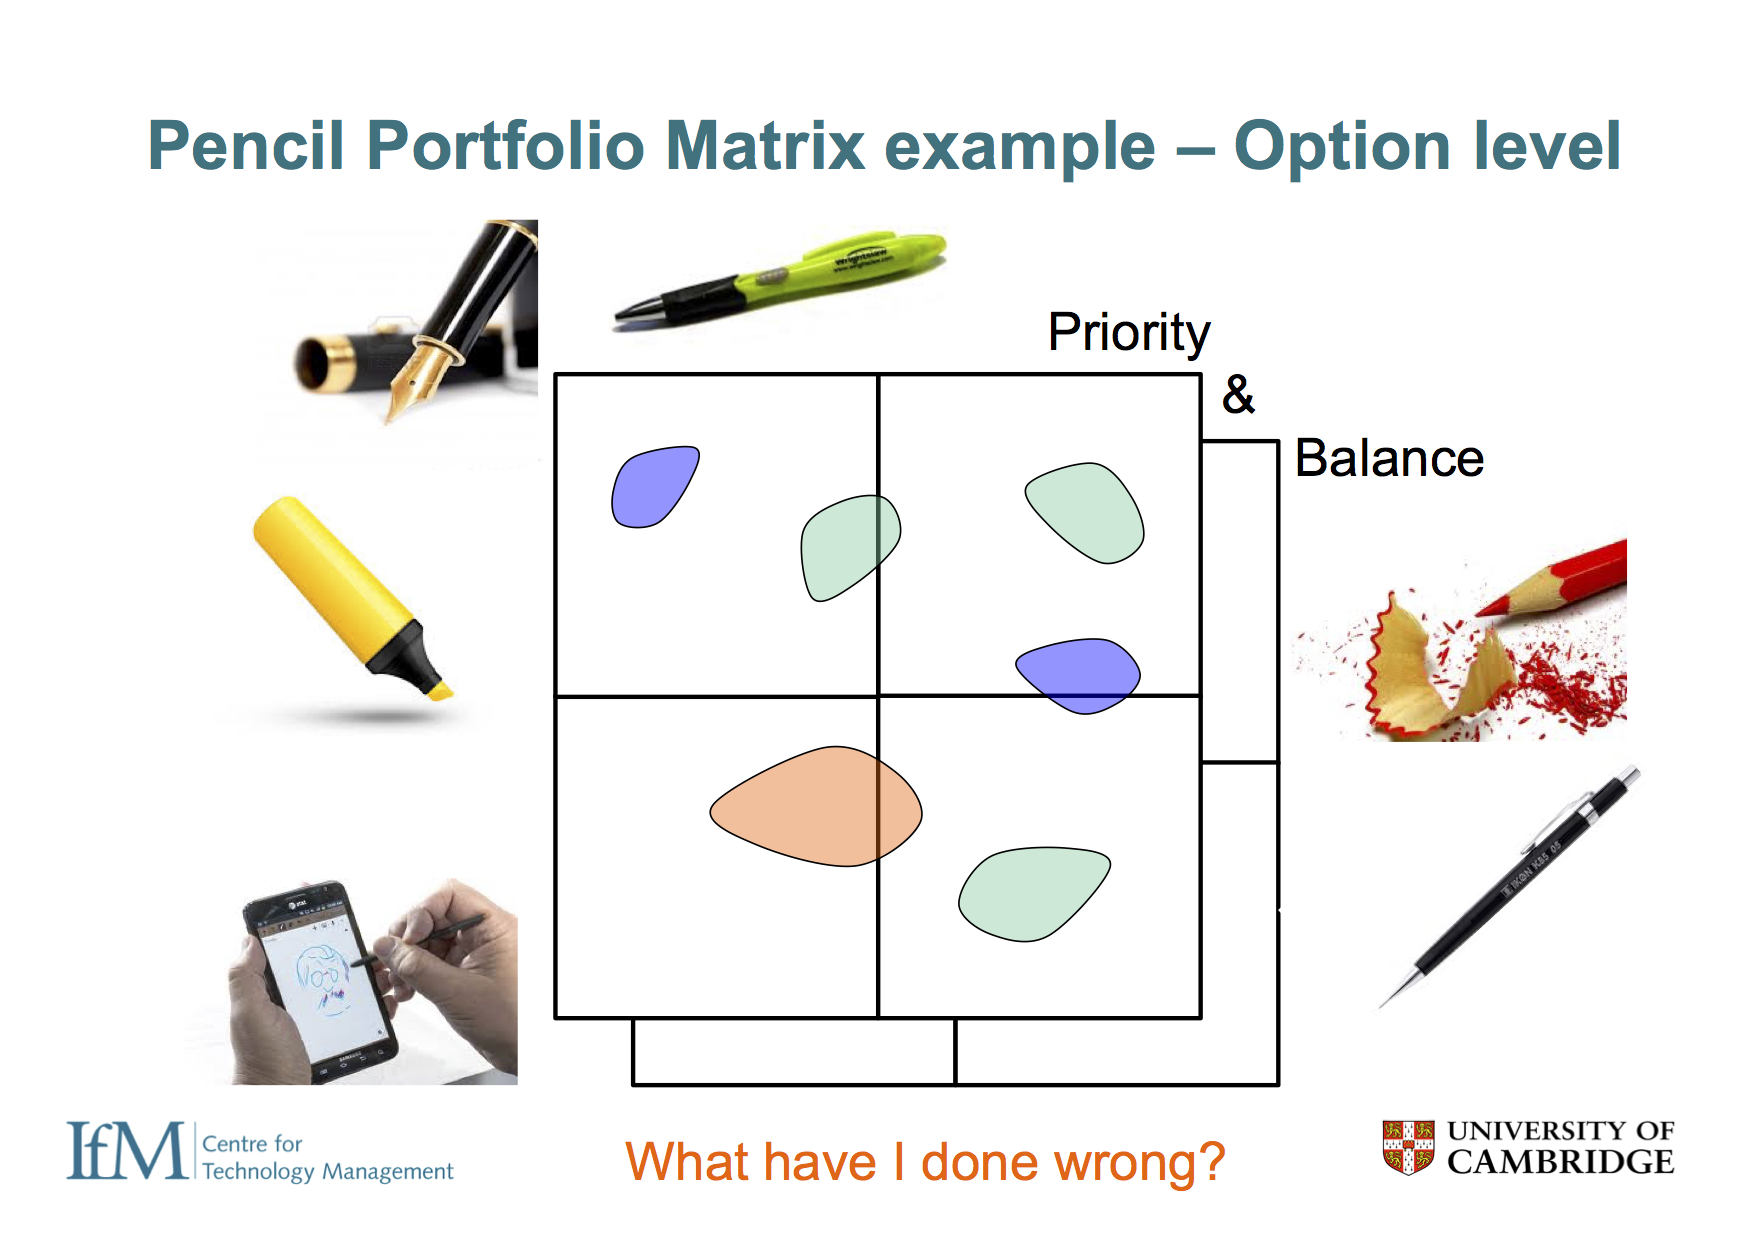
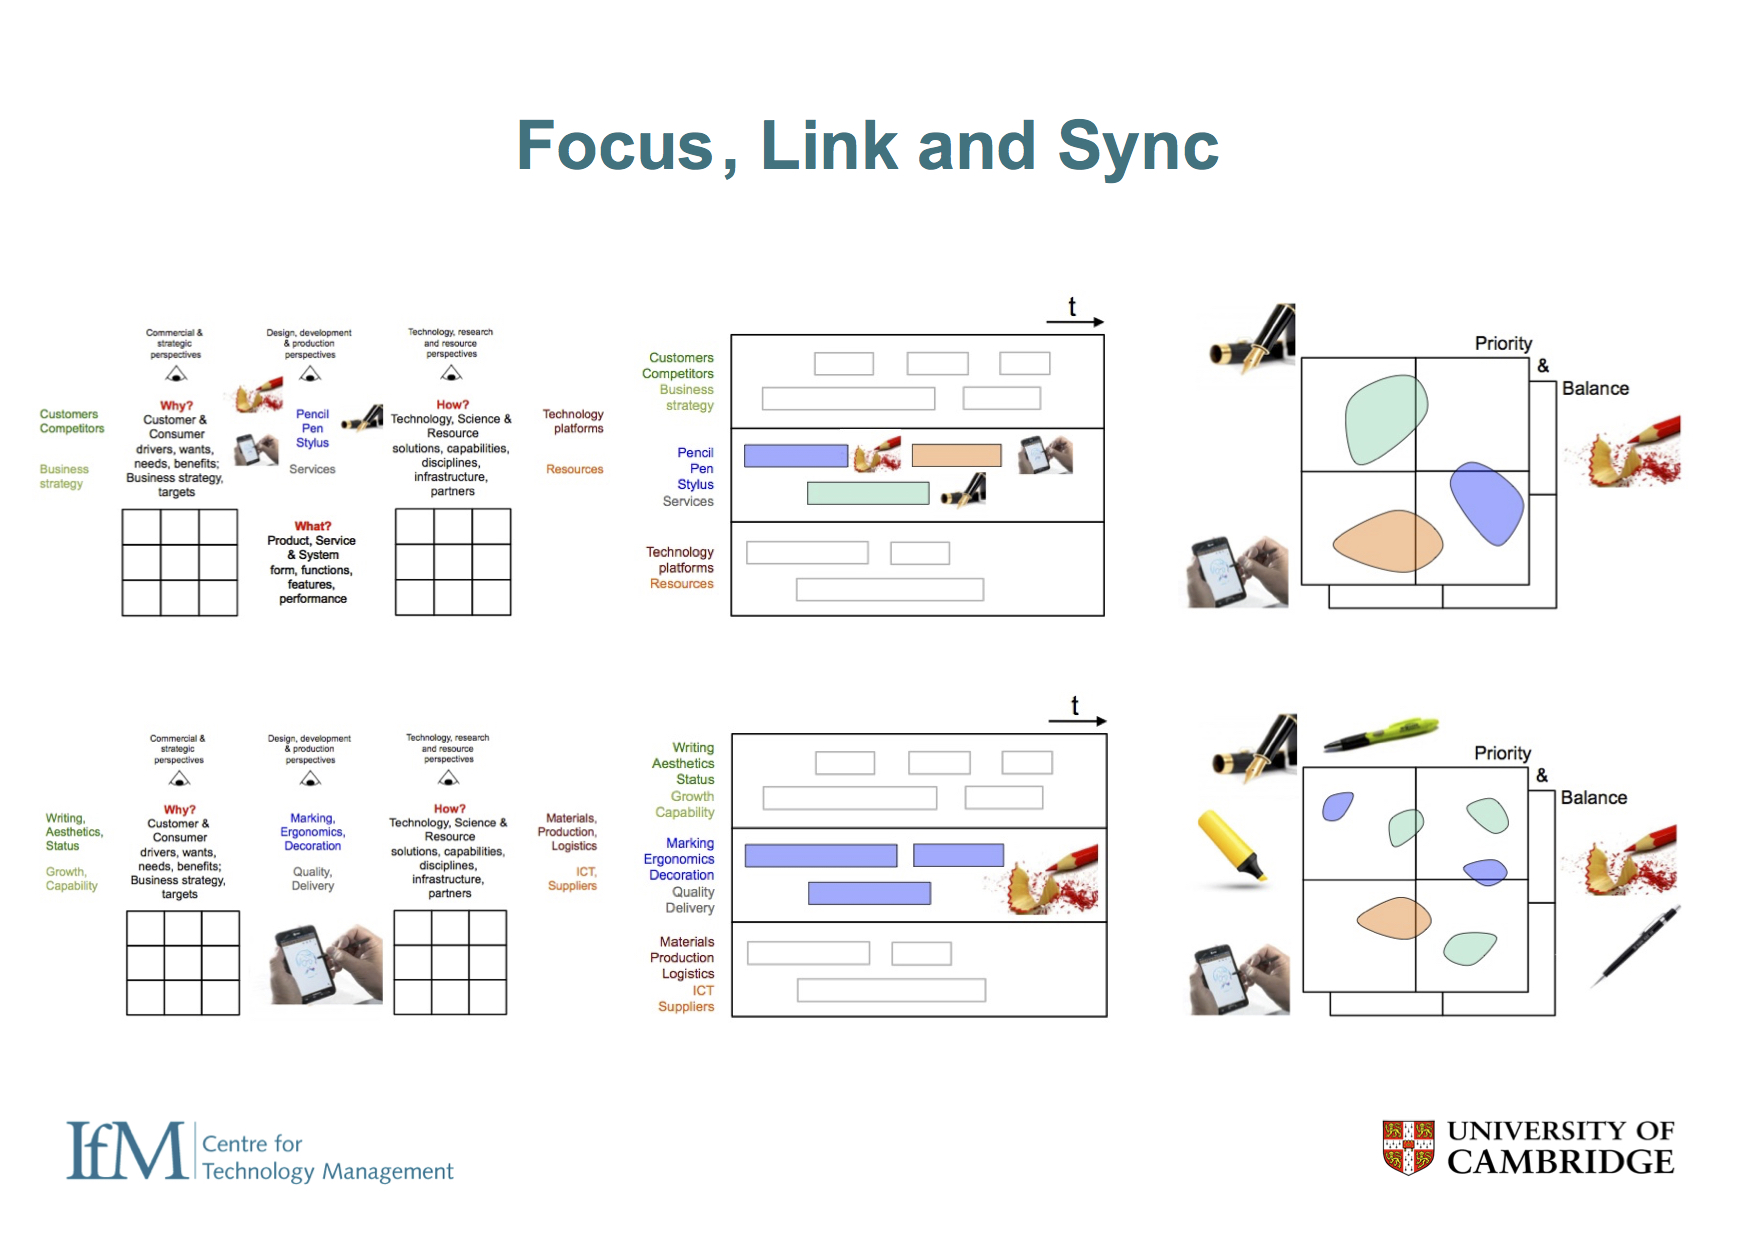
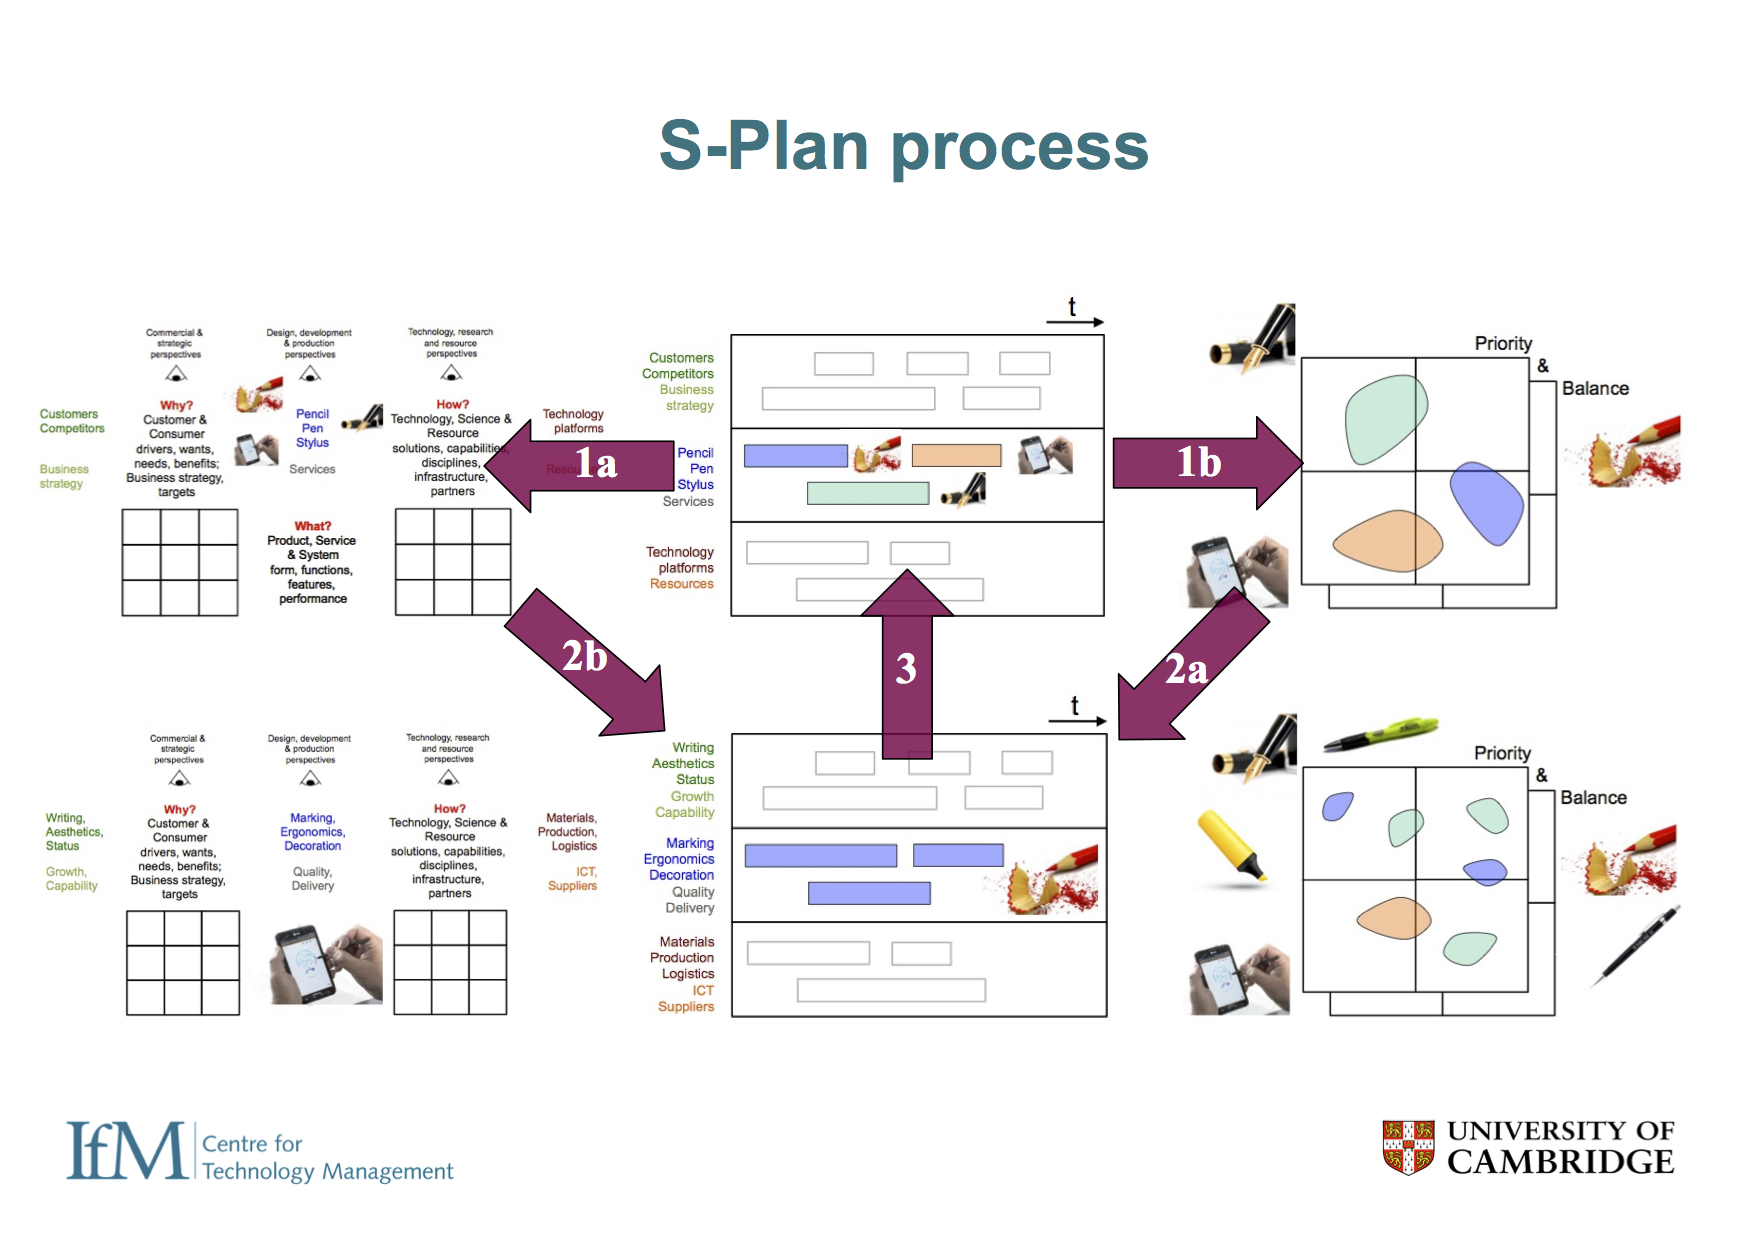
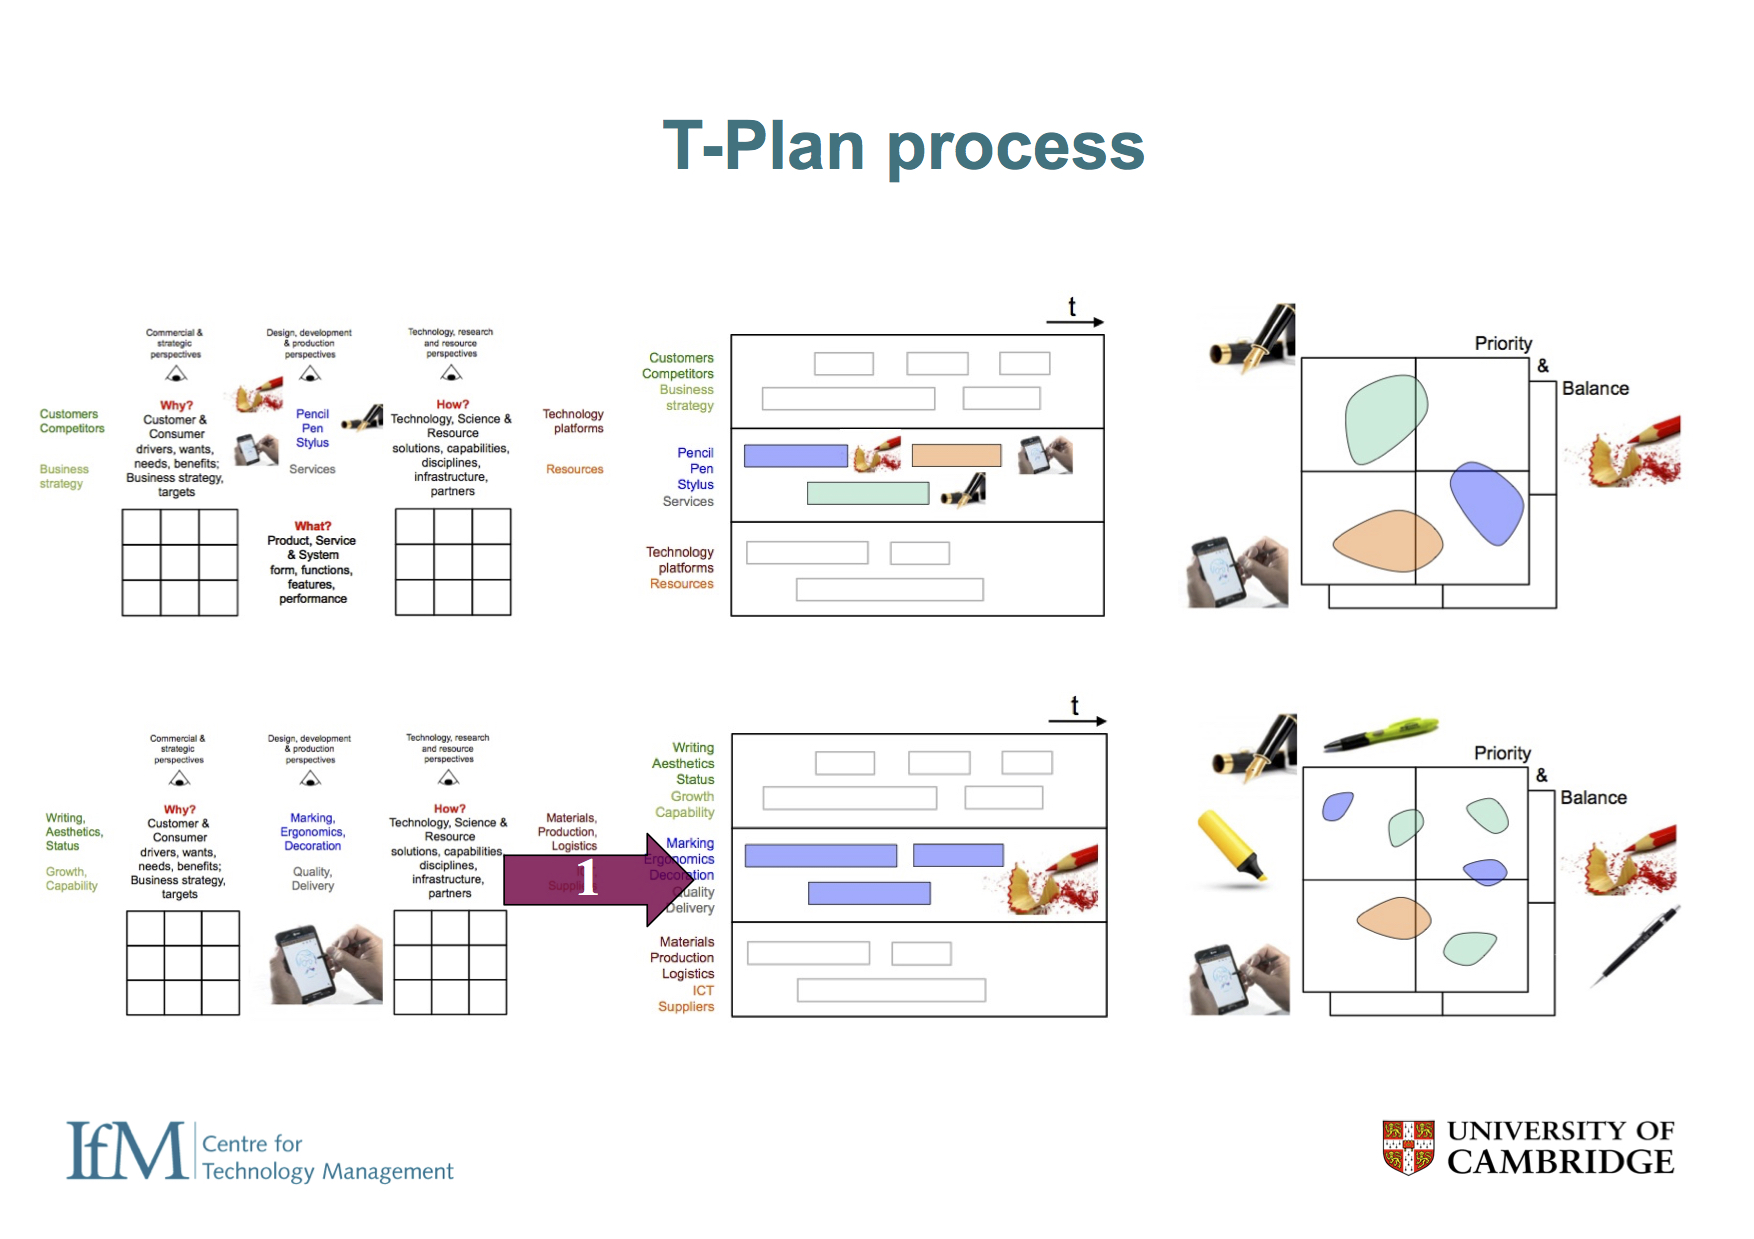
The toolkit concept is illustrated in the slide show below for the simple 'pencil case', showing how the three core tools apply at two levels (option & portfolio), starting with the linking grids (mouse hover for annotation):
Other perspectives
Management tool resources
Catalogue of decision support tools from the University of Cambridge, Institute for Manufacturing.
Set of design management tools and techniques collated by the Design Research Group, Institute for Manufacturing, University of Cambridge.
UK Government Futures Toolkit provides a set of tools and techniques to help government officials use long-term strategic thinking in policy making.
Praxis framework, body of knowledge and tool catalogue for project, programme and portfolio management
Compendium of tools and resource links from the OECDF Observatory of Public Sector Innovation (OPSI).
Human-centred Design Kit from IDEO.
Management methods, models and theories relating to ‘value based management’.
Continuous process improvement tool catalogue.
If you have any queries regarding research, training, collaboration or other support please contact me at rob.phaal@eng.cam.ac.uk.