Architecting roadmaps
How to architect a roadmap, or a family of roadmaps? To answer this question requires some thought and design effort, as roadmapping is a flexible approach requiring configuration; the context and purpose can vary enormously; and strategy is characterised by high levels of volatility, uncertainty, complexity and ambiguity. There are no universal nor agreed management theories that can be applied to all applications and contexts. An internet search will reveal a bewildering array of uses (and misuses) and graphical options (the set below is illustrative of this), which can be confusing. However, there are some principles that can support the design of coherent and useful roadmap structures, which can be readily tested and refined through use.

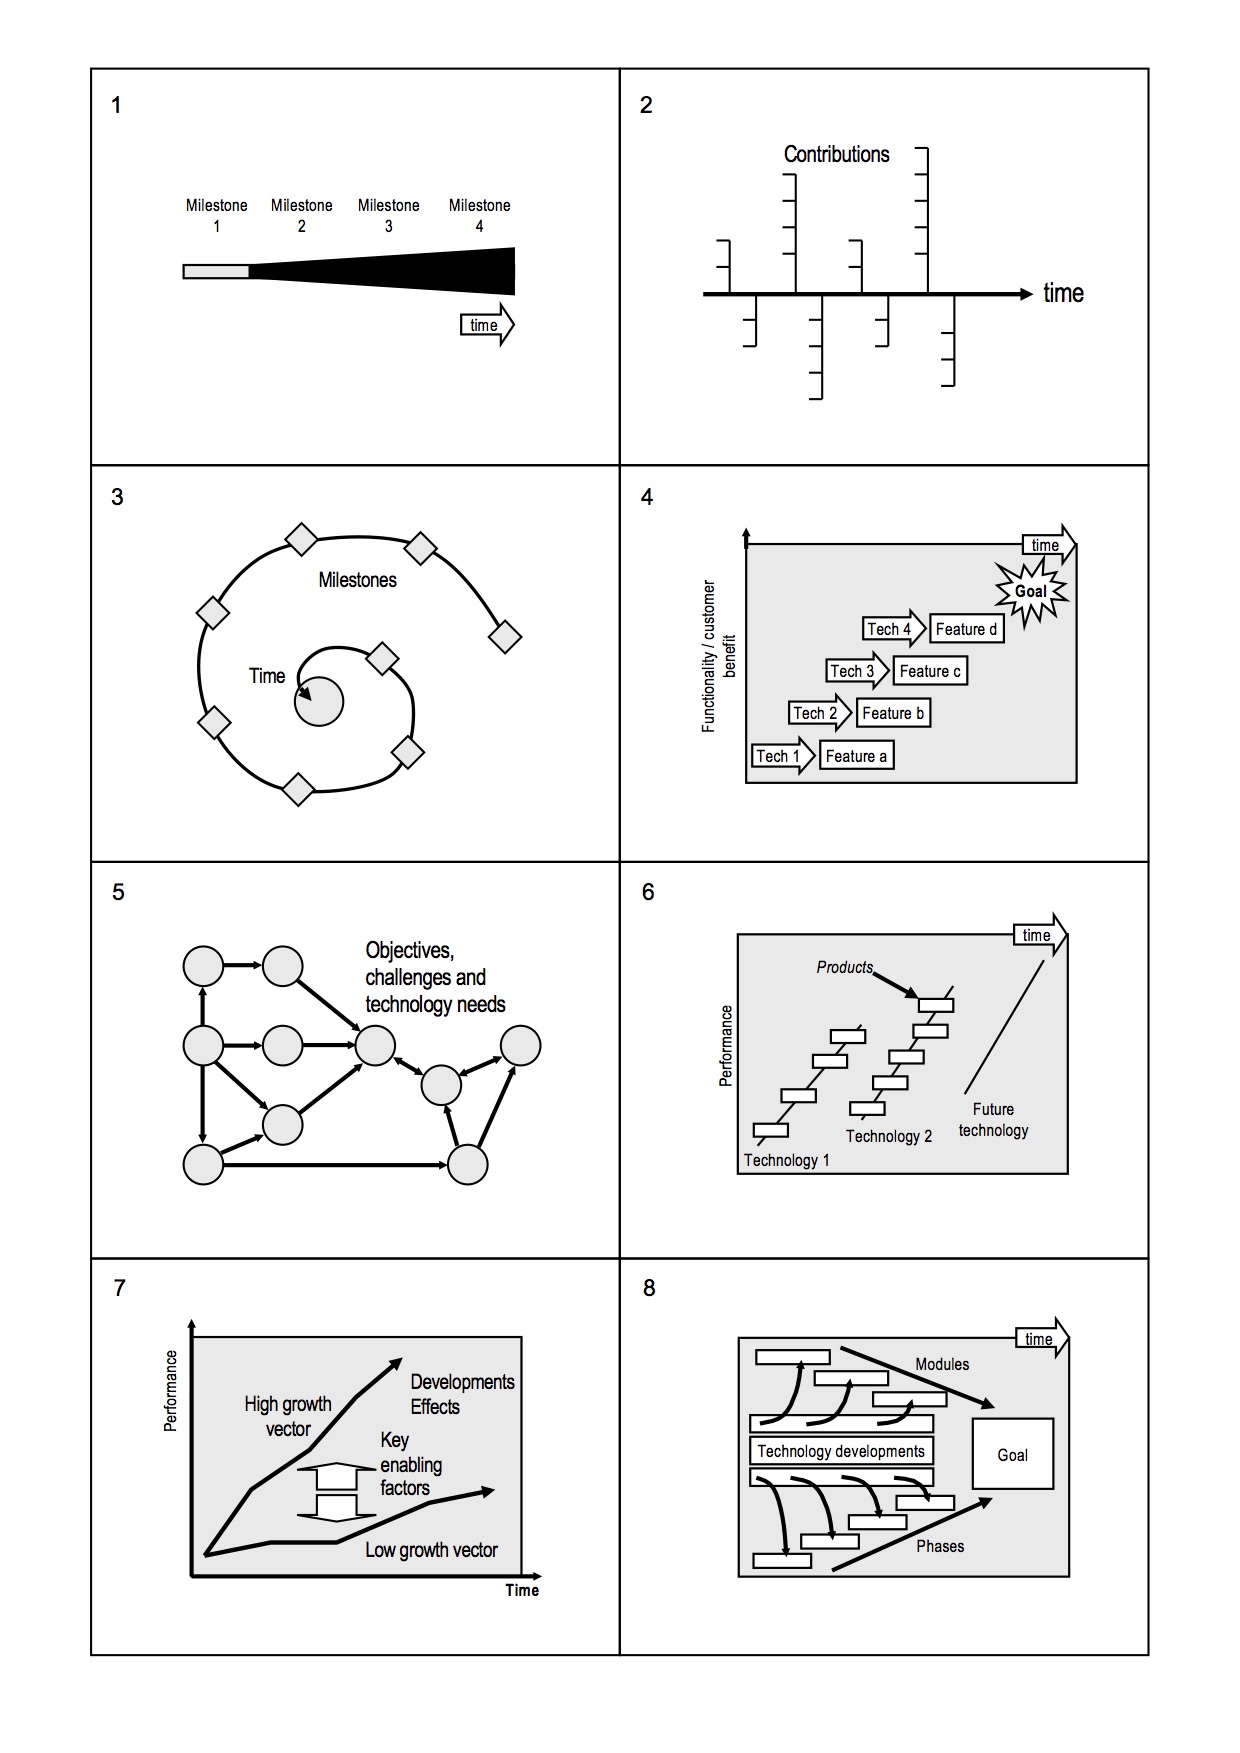
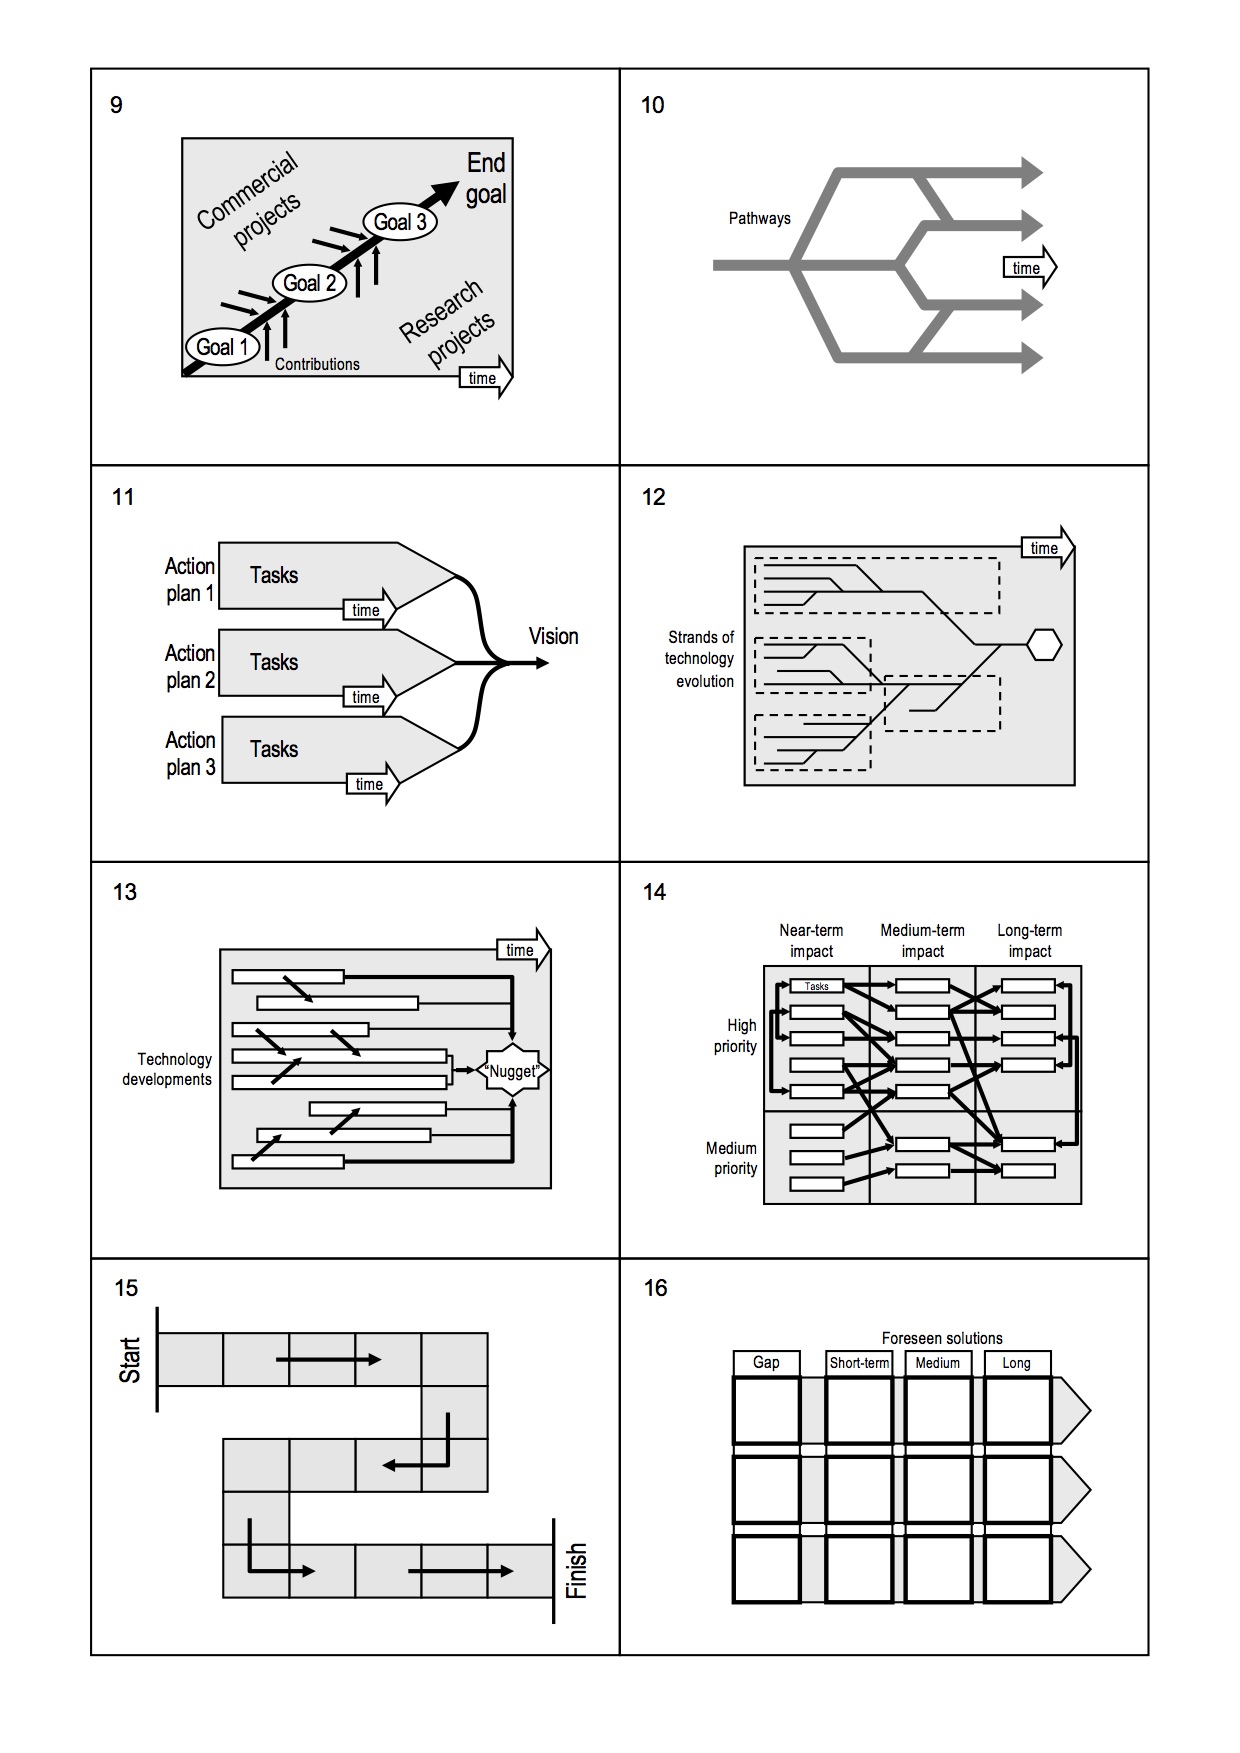
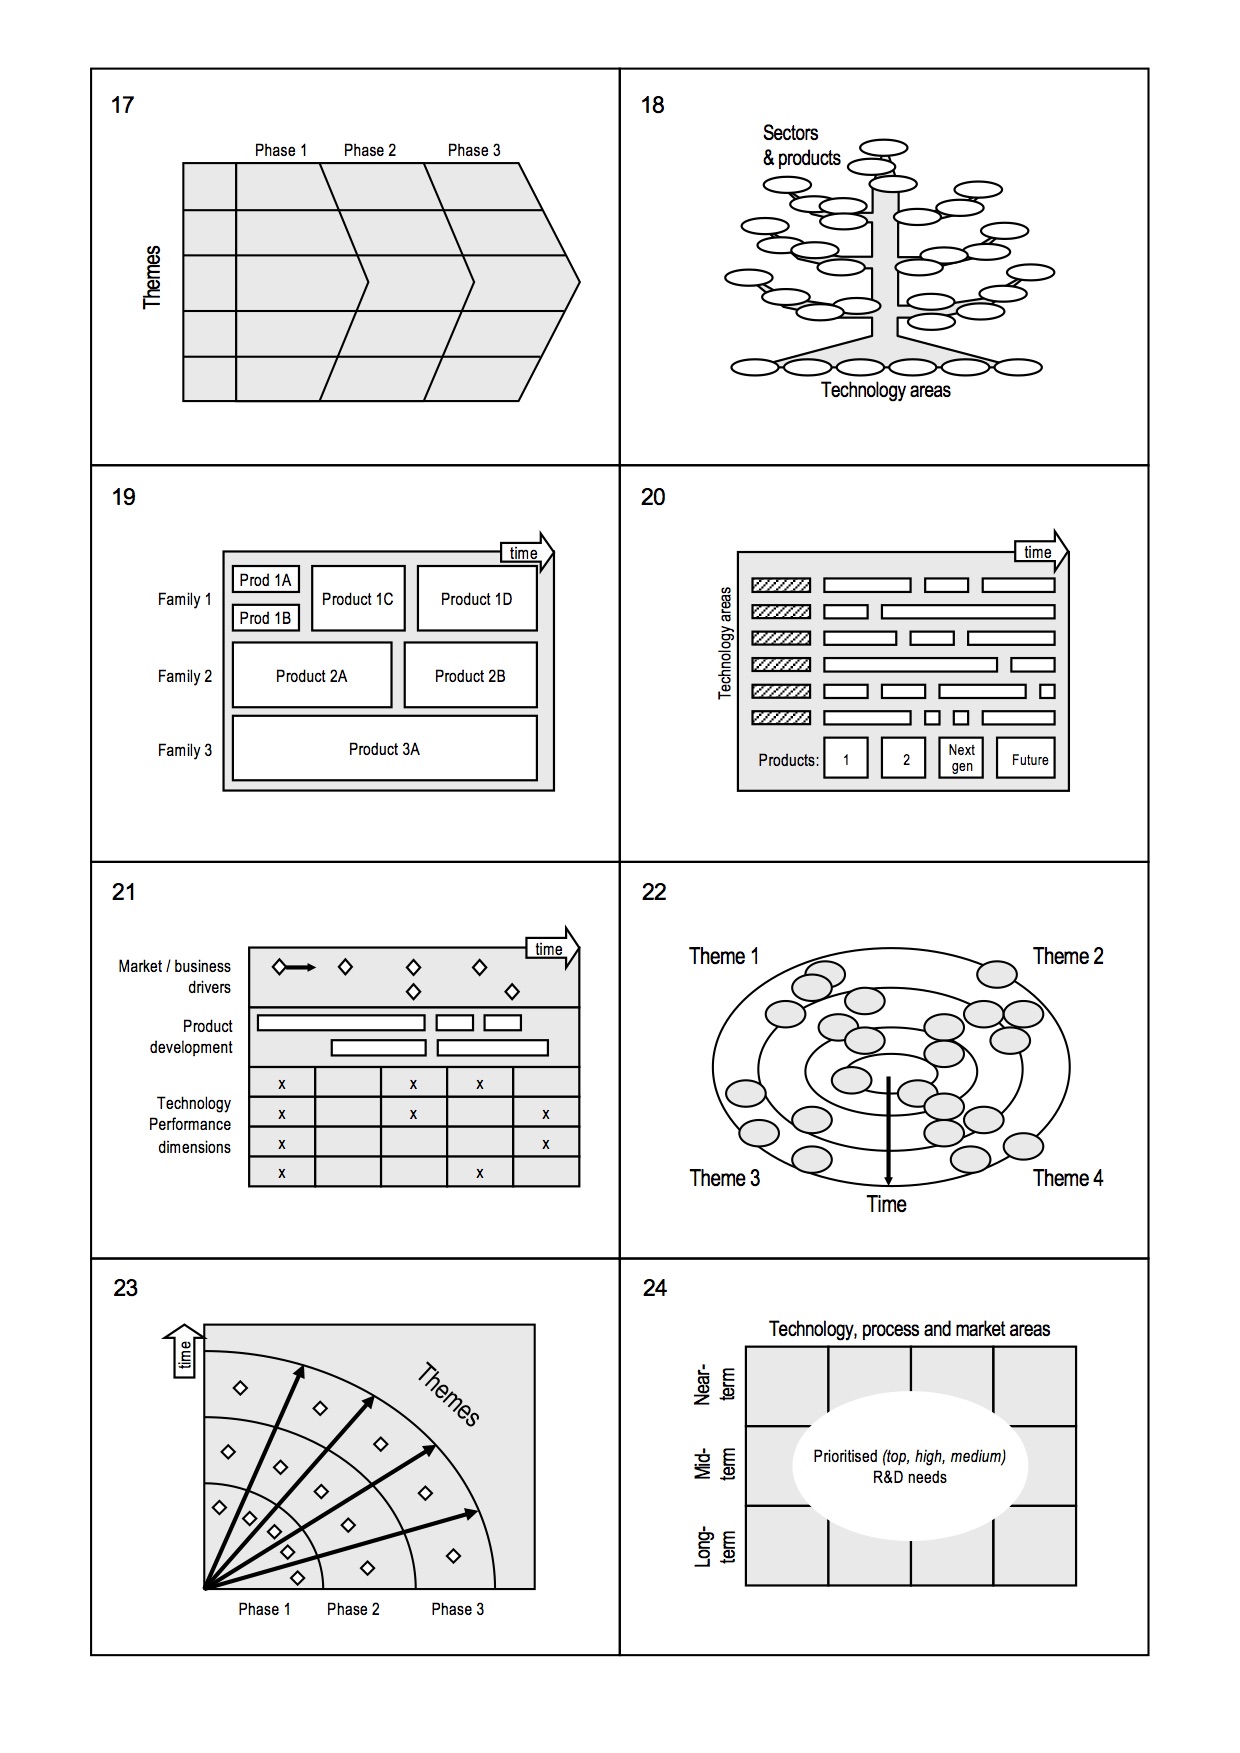
Roadmaps can take many forms, depending on purpose and context (Phaal/Blackwell et al, 2009/8)
Roadmap purpose and format
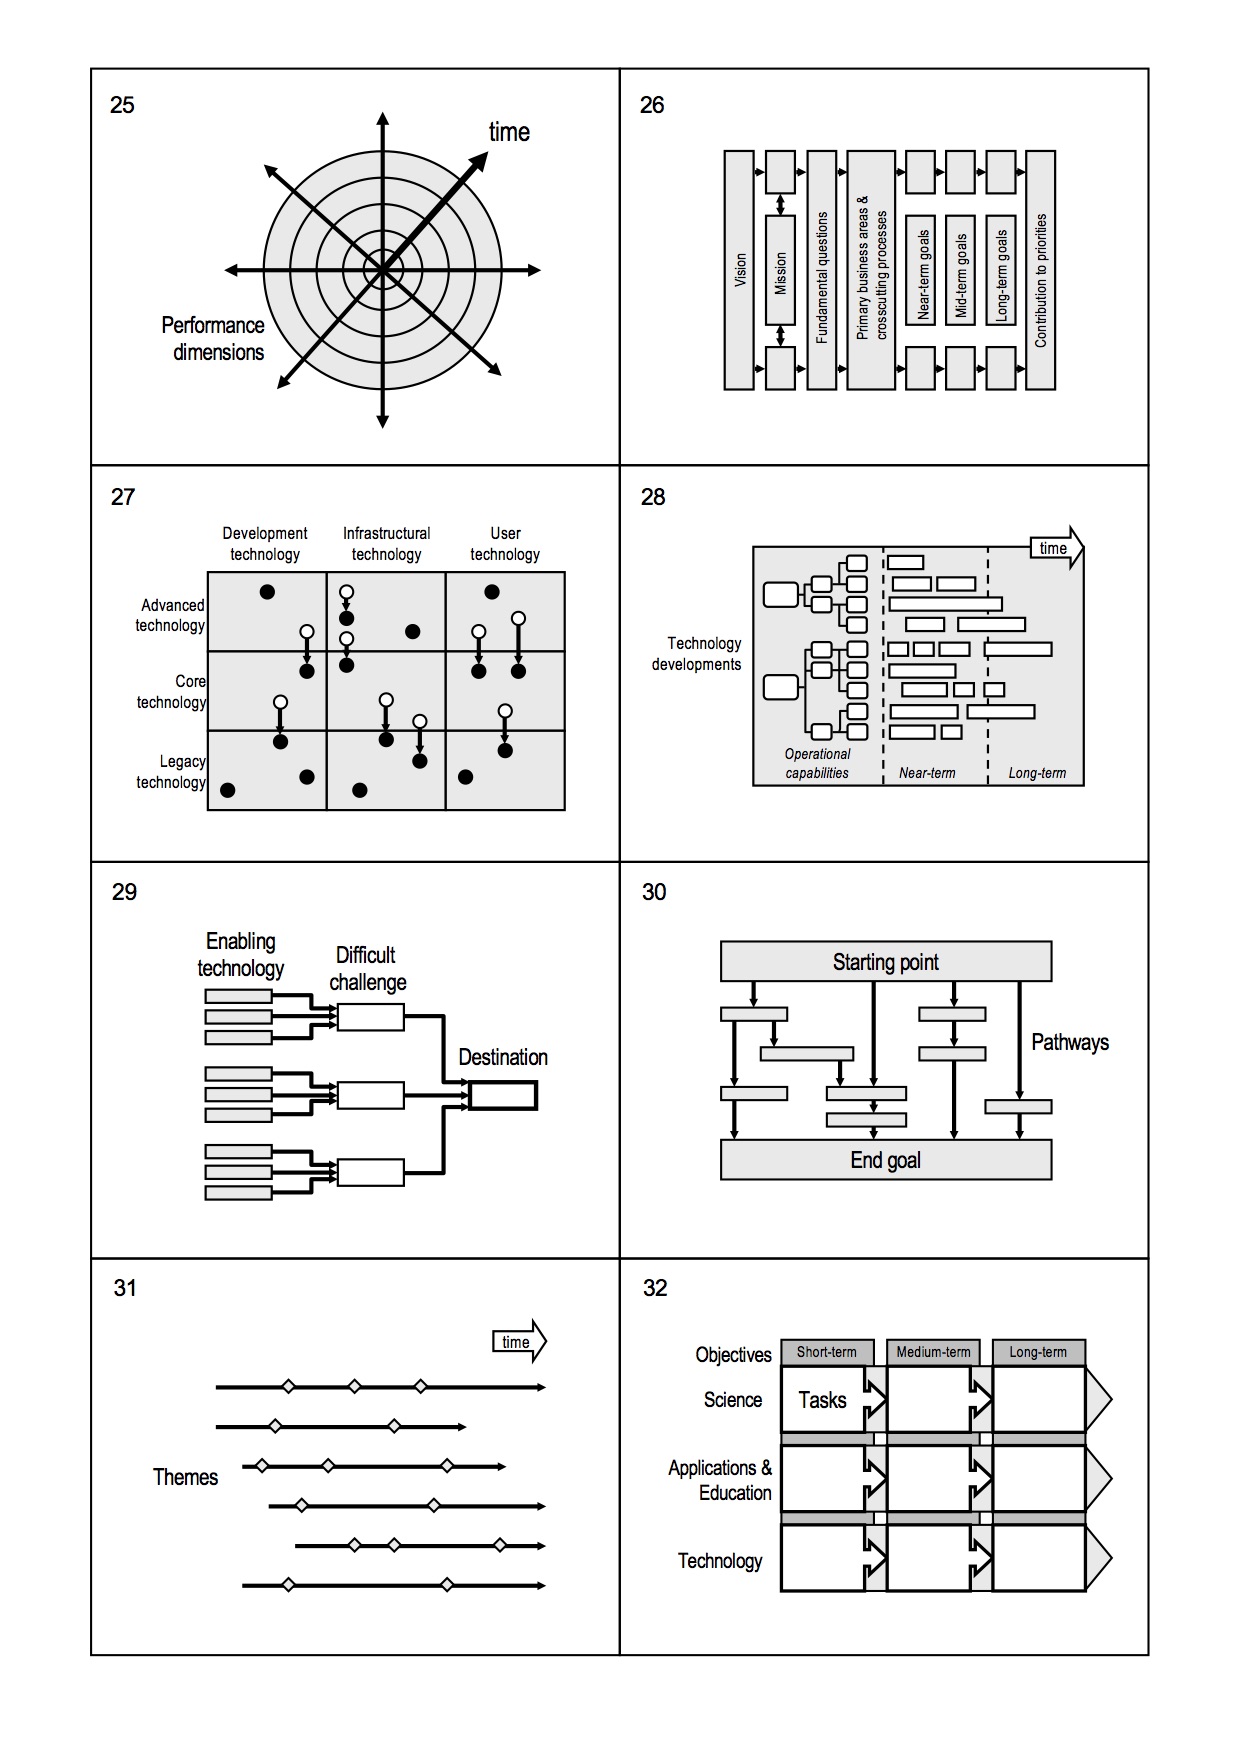
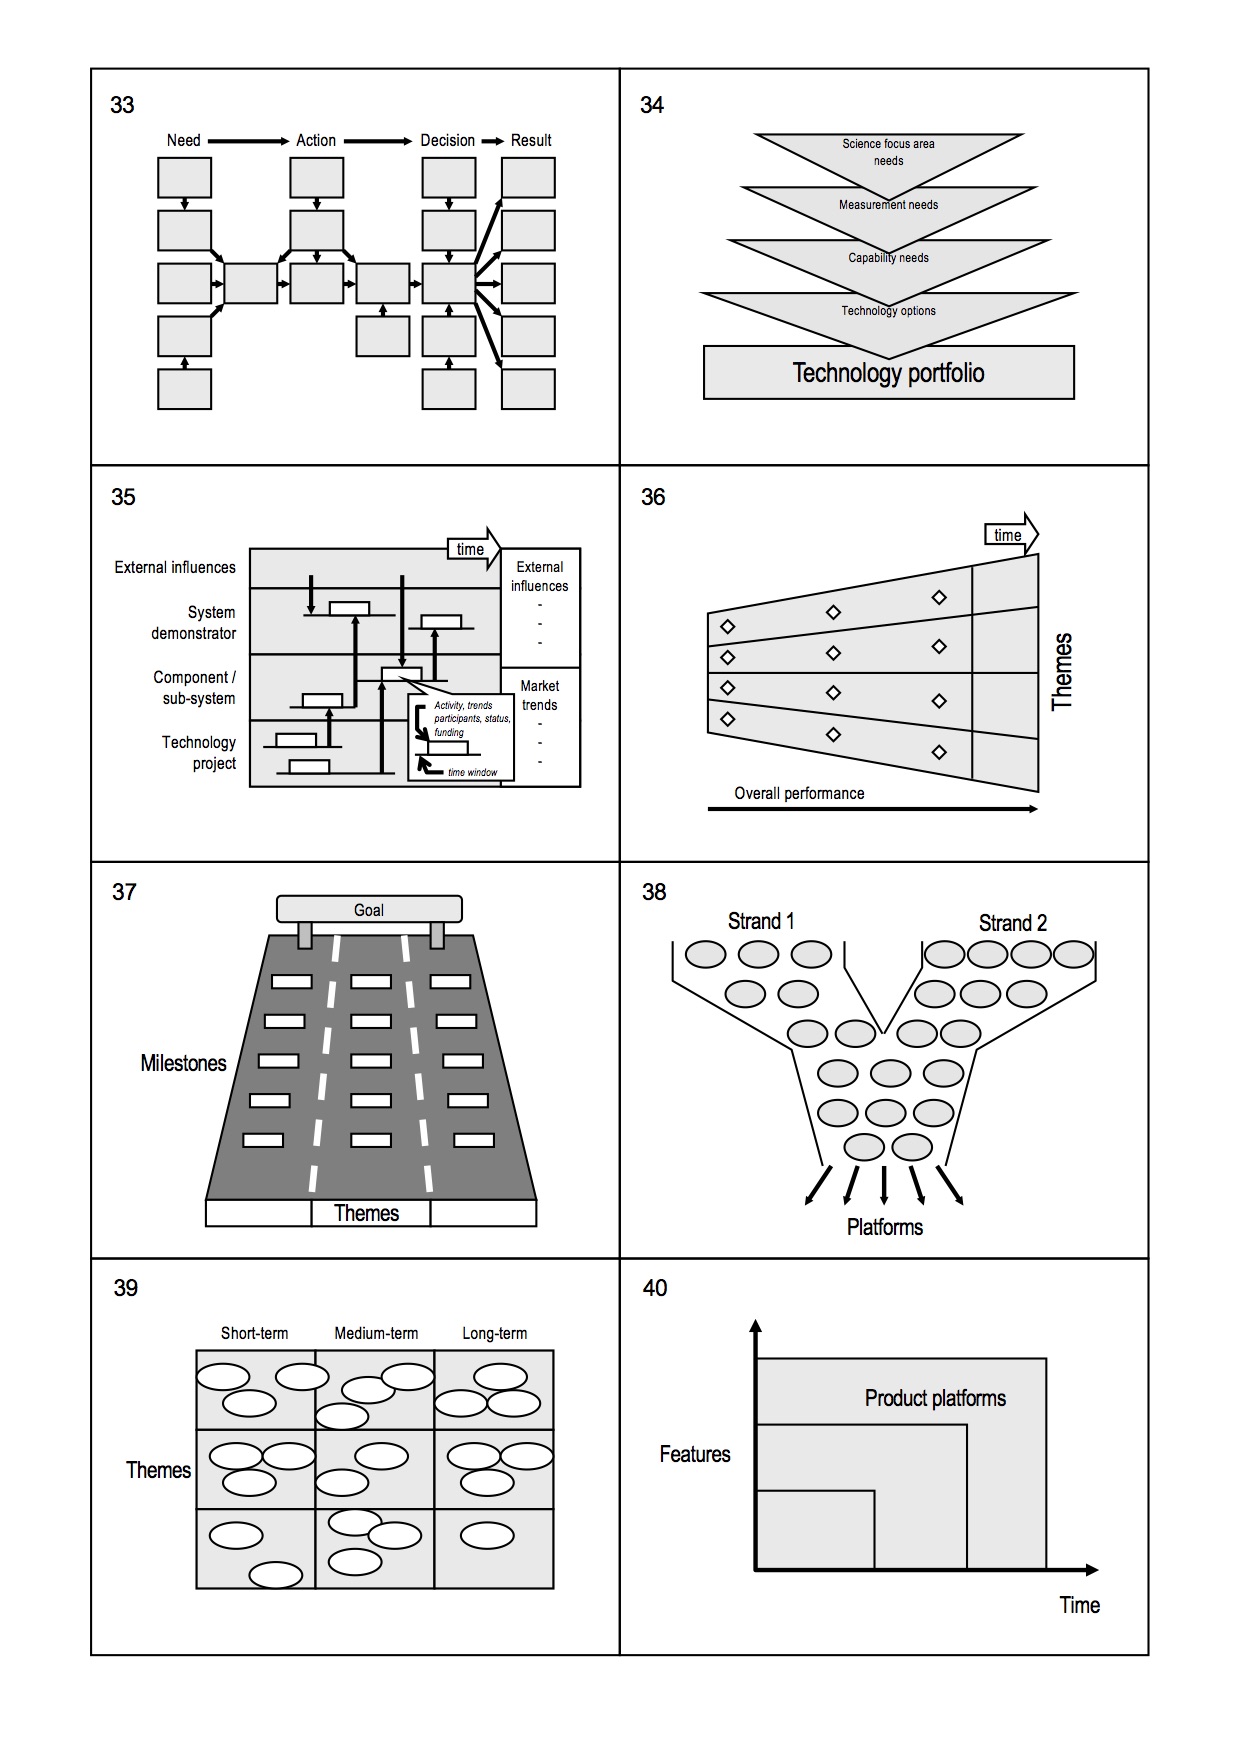
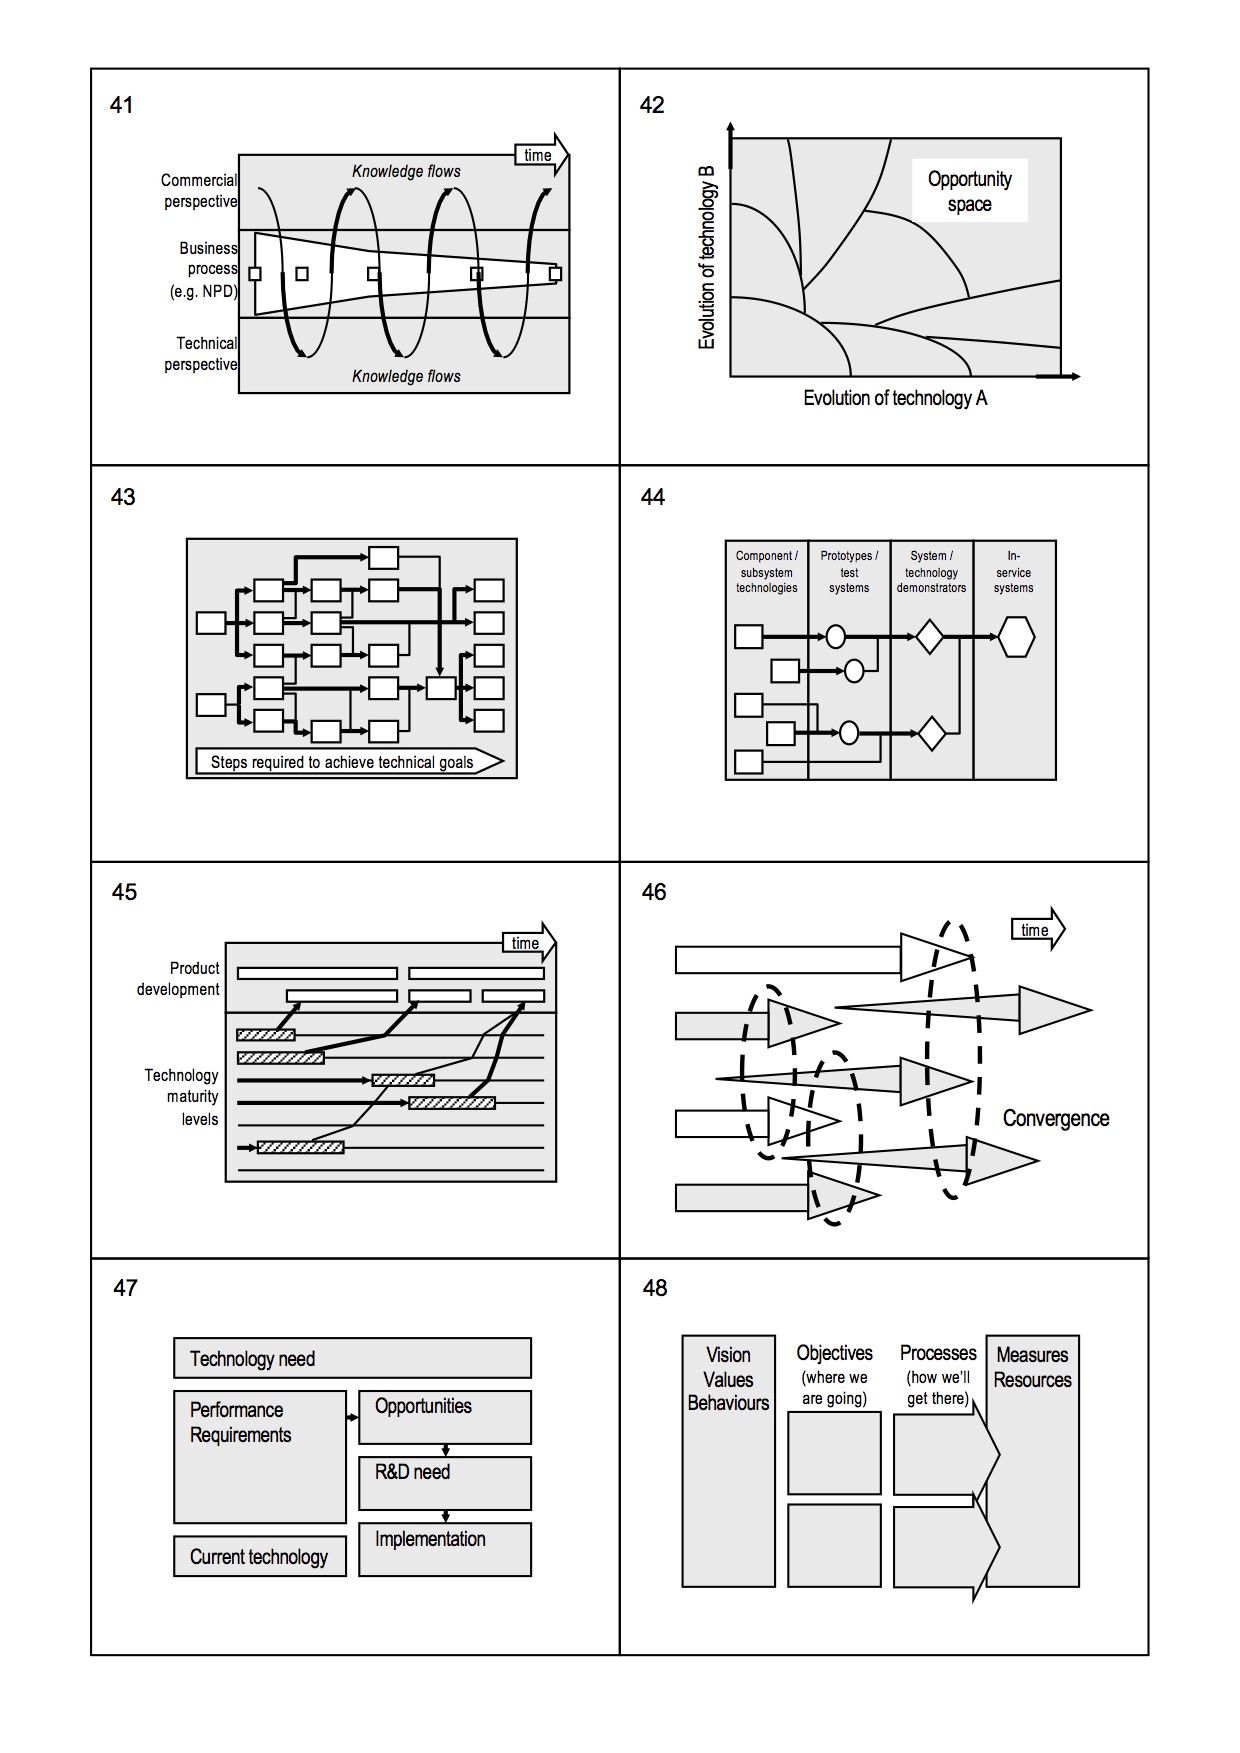
Examination of roadmaps reveals a great diversity in terms of the domains and purposes to which the method has been applied, and the graphical format, as illustrated below. This diagram, from the most highly cited academic paper on roadmapping, is often misinterpreted as a comprehensive taxonomy, which it is not. The diversity of purpose is much greater than that shown here, which are examples of roadmaps observed in 2004. Most examples related to product planning and long range planning (foresight), with other examples illustrating the diversity of application observed, which has expanded greatly since that time.
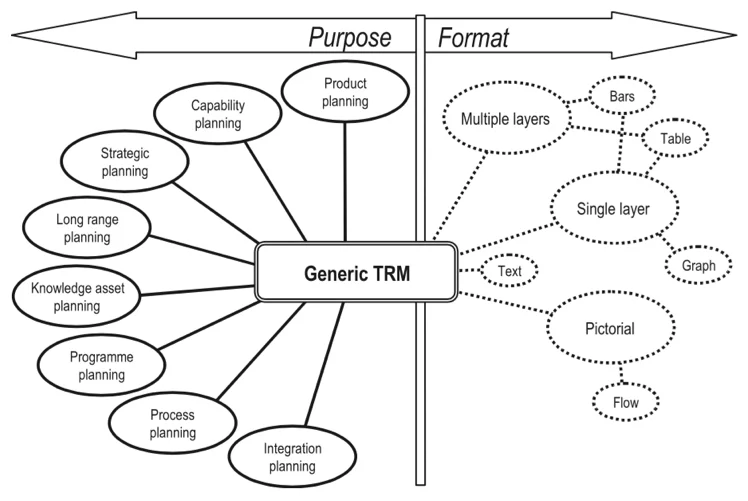
Roadmaps can vary a lot in terms of both purpose and format (Phaal et al., 2004)
Complexity in roadmaps
In addition to purpose and format, to understand the diversity of roadmaps it is helpful to consider how complexity is dealt with, in terms of both information structure and content, as illustrated below. For example, some roadmaps have a very simple structure, but contain lots of information, while others have a complex structure populated sparsely. Generally, less complex roadmaps are useful for communicating key messages, providing the big picture, with more complex roadmaps helpful for fleshing out the detail, providing the full picture, to enable strategic planning and implementation. It is helpful to work with both types, for successful communication and implementation of strategy.

Roadmaps can be positioned in terms of complexity in two dimensions - information structure and content (Phaal et al., 2009)
The figure below categorises roadmaps into three broad types, with the most common (80% of a sample of 400) comprised of one or more time-based layers, which can be divided into sub-types of increasing structural complexity. Type 3 is more pictorial, using explicit metaphors to support communication, such as mountains, board games, funnels and the rather obvious cartographical roadmap metaphor (care should be taken with this type, which can be very powerful, but also not universally appreciated). Type 2 are called 'roadmaps', but do not include the time dimension and are generally building blocks of roadmaps, focusing on aspects of system structure, relationships and process.

Roadmaps can be divided into three types, with the most common (Type 1) comprising one or more time-based layers (Phaal et al., 2009)
Roadmapping as a dynamic systems framework
The roadmap 'lens' can be considered as comprising two layers: 1) information structure and 2) graphical format and style. Here the focus is on the underlying information structure of roadmaps, as represented in the standard multilayered time-based sub-types (1d&e above), rather than graphical style, which can dominate human perception (see News & Info - communication roadmaps)
For the multilayered format the main conceptual basis is 'systems thinking' (both 'hard' & 'soft' systems). Most roadmaps are of this type, as was the early technology roadmap published by Motorola in 1987. Note that this format, as displayed, is a rather literal interpretation of the underlying systems-based data structures, which can be rendered graphically in many ways (e.g. as fishbone diagrams, polar charts, block diagrams). The underlying information architecture and graphical interface are separate 'layers' in the roadmapping 'lens', and the architectural thinking represented below can be applied to other formats, for coherence.
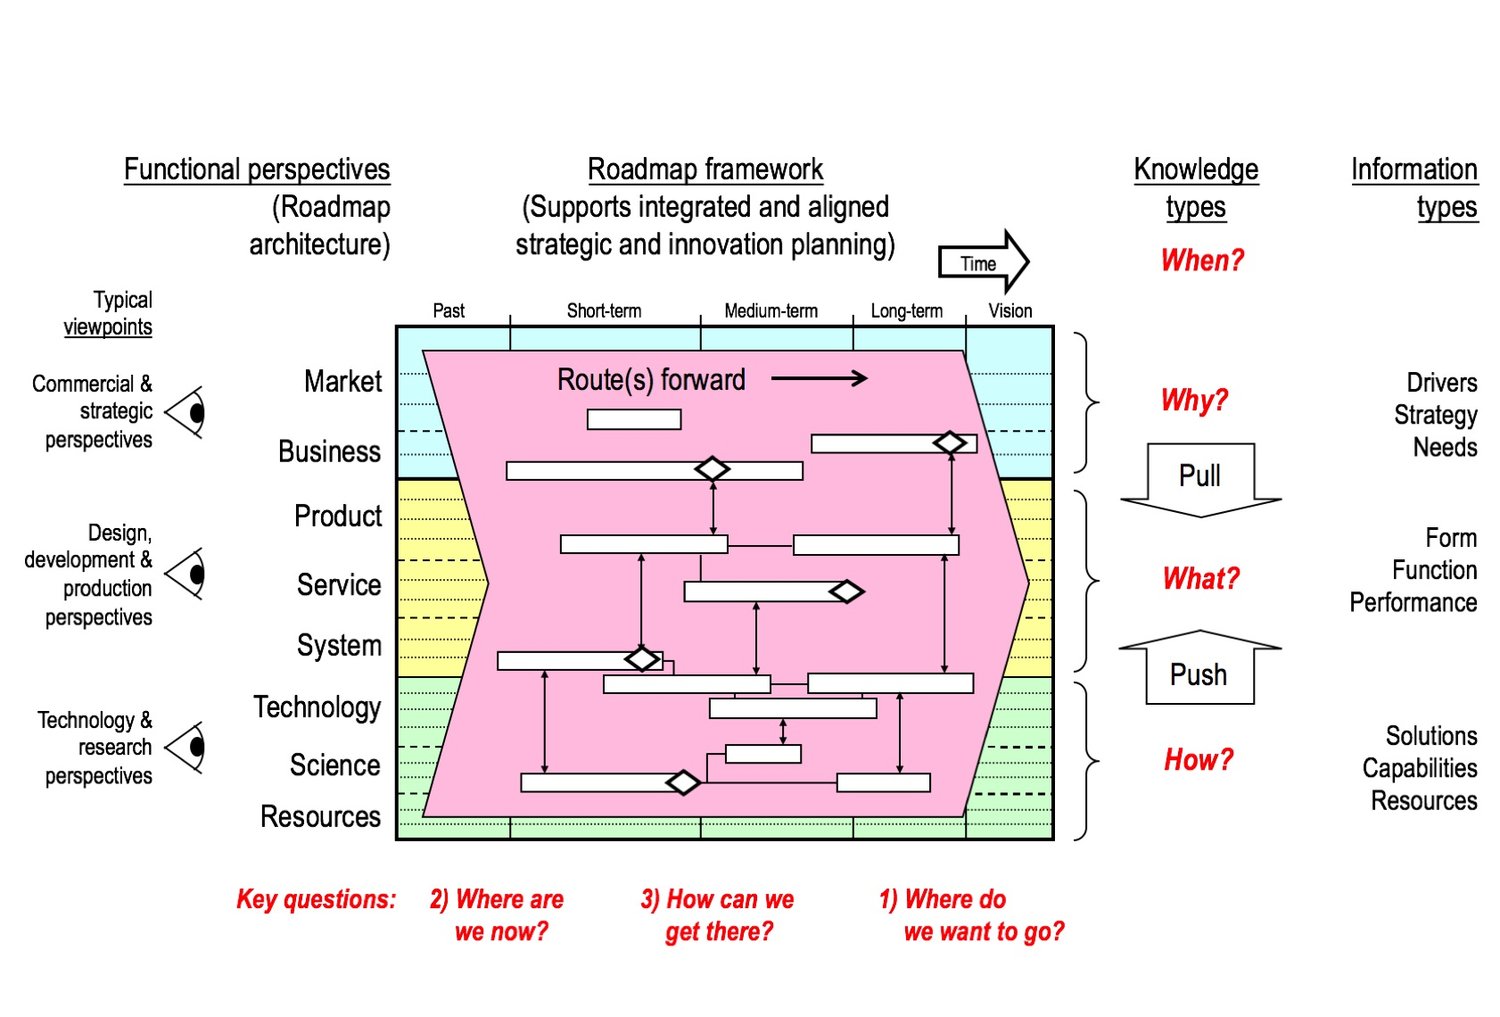
General purpose multilayered time-based dynamic systems framework (Phaal & Muller, 2009)
Roadmaps of this type provide a systematic structured 'language' (categories, defining layered structure, necessary for effective communication within and between organisations, for strategic alignment), set against time, from the past to the future. Considered in this way, roadmapping provides a general purpose 'dynamic systems framework' that can be applied to any developing, evolving or changing system (incremental to radical / transformative), including temporal relationships between elements of the roadmap, allowing synchronisation.
Layers typically represent various stakeholder perspectives, organisational structures and taxonomies. Generally it is sensible, initially at least, to use existing organisational structures and language in the roadmap design, unless a different perspective is desired - e.g. cutting across existing structures and perspectives. If wider deployment of the approach is intended then account should be taken of the wider system from the start, in terms of roadmap architecture.
Generic roadmap form
The most generic form comprises a 3x3 matrix defined by six broad questions, highlighted in the diagrams above and below. However, this is just the structure - the easy part. The content and associated strategy and organisational challenges that must be faced to implement strategy require a lot more than a diagram to address. Roadmaps have been referred to as "dirty mirrors", revealing unpleasant organisational truths that may need to be confronted to move forward; don't blame the messenger. As such, early (rapid) iterations of roadmapping serve a diagnostic function, supporting problem solving and learning, as the basis for deciding next steps.
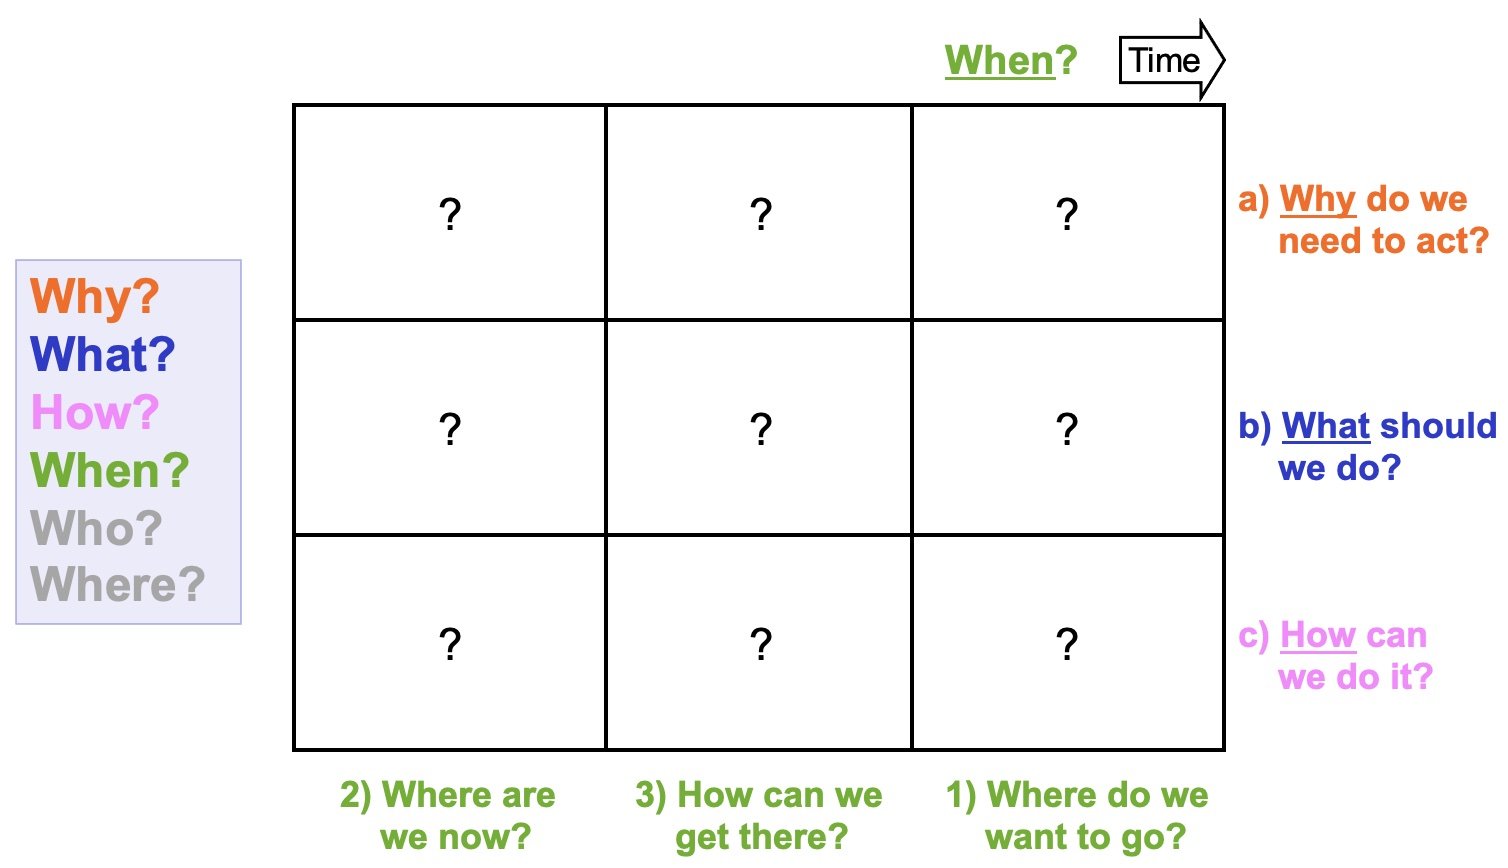
Six fundamental questions underpin the structure of roadmaps, 4 explicitly and 2 implicitly, respectively: Why, What, How & When, and Who & Where? (Who and Where are important, representing stakeholders & ownership, directly associated with roadmap structure and content)
A workshop template based on this generic form is available to download here.
The roadmap structure provides a ‘canvas’ that can help to organise strategic information in a coherent way, with the fundamental underpinning questions universally applicable. From, a knowledge management perspective, a roadmap can be considered as a useful ‘knowledge hub’, which allows information and understanding to be synthesised and reviewed at critical points in any process that roadmapping serves (for example, aligned with new product development stage-gates). This perspective on roadmapping is illustrated in Fig (a) below, in terms of the widely used ‘5W1H’ method, which identifies six fundamental questions for general problem solving. Four of these relate directly to roadmap structure (why, what, how & when), with the others (who & where) more implicit, relating to stakeholder perspectives, ownership and location of roadmap layers and objects. The 5W1H method is also known as ‘Six honest serving men’, after Kipling’s 1902 poem: “I keep six honest serving men; They taught me all I knew; Their names are What and Why and When; And How and Where and Who.”
The sub-categories used to elaborate the general ‘why-what-how’ perspectives will be specific to the context and problem being addressed - typical examples for industrial applications are illustrated in Fig (b) & (c) below. Within each of these categories knowledge, information and data can be organised according to appropriate knowledge taxonomies, typically represented as sub-layers in the roadmap structure. The granularity of this structure, and hence roadmap content, can adjusted to suit the focus, with the overall roadmap defining the scope, including internal and external parts of the system, in terms of both demand and supply (top and bottom, respectively). The content of a roadmap is organised according to this structure, overlaid on the canvas, as illustrated in Fig (b). Note, for communication purposes it may not always be appropriate to explicitly use this structure for roadmaps, which can be implicit rather than explicit, although for roadmap development and implementation explicit representation is helpful.
Creation of the roadmap will involve a process of strategic planning, including analysis and synthesis of relevant strategic elements and issues, some of which are illustrated in Fig (c). As roadmaps are really just structured canvases for organising and communicating strategic information, and roadmapping is a service to processes such as innovation and strategic planning, any approach or framework found in strategy and innovation textbooks can be a useful aid to roadmap development, without conflict.

Much of the value of roadmapping lies in its social dimensions (i.e. ‘who’), providing a common reference point for communication, consensus and action, reducing information asymmetries and conflict. Understanding that roadmapping is much more than a data artefact is key to unlocking this value, with each roadmap, layer and object assigned ownership - i.e. ‘stakeholder layer’ perspective shown in the diagram below, with the roadmap providing a map of stakeholder perceptions, aspirations and commitments. Links and arrows in roadmaps often look rather insignificant, but are the most interesting and important visual objects, connecting disperate objects into coherent narratives, establishing critical dependences within the system. Motorola understood the importance of this more than 30 years ago, requiring a consensus-building process for the creation of roadmaps, with links between objects requiring acceptance from owners of both objects being connected.

Roadmaps are two-dimensional diagrams, representing three structural dimensions (Vinayavekhin & Phaal, 2020), as illustrated below. As a top-down approach, hierarchical aspects of the system are represented as a projection on the roadmap, defined primarily by functional and temporal dimensions. The multi-layered format often used in roadmaps does allow this hierarchy to be explicitly depicted, at least in part. The ‘dynamic range’ of a roadmap may be much higher than reflected explicitly in its structure - i.e. data contained in a roadmap may be separated by many orders of magnitude, with reference to the knowledge taxonomies associated with the roadmap.
For example, a great deal of detail may be required about the technical choices relevant to a component of a complex product, which might be connected to a broad demographic trend. More granularity than is needed should be avoided, as this increases complexity, noise and maintenance demands, reducing effectiveness and obscuring key messages. In this sense roadmaps need to be ‘tuned’ to fit the problem, at an appropriate level of granularity, which can be dynamically adjusted - for example, if a particular issue is of concern then this can be expanded in more detail for a deep dive without losing the broader context, allowing ‘pan & zoom’ functionality.

Although these concepts may seem quite abstract, they are what makes the roadmapping approach so powerful and flexible, as a universally applicable approach, which has to be configured to purpose. Often these three dimensions are not explicit in strategy, and they provide a useful ‘checklist’ for addressing strategic problems in practice, as they pervade all aspects. The barriers to effective strategy development and deployment in complex systems is hampered by information asymmetries, communication inefficiencies and conflict. The structure and visual nature of roadmaps provide an effective means for spanning these boundaries, building common understanding and consensus, and a reference point for moving forward in unity, addressing system alignment, integration and synchronisation.
The three strategic dimensions in Fig (a) above define a 3x3x3 ‘strategy cube’ (b), shown on the right, which defines the strategic space (scope) relevant to a problem, and from which data represented on a two-dimensional roadmap can be drawn. In terms of hierarchy it should be noted that a single roadmap will contain multiple taxonomies, relevant to the kind of knowledge represented. For example, part of the ‘why’ layer often represents market segments, which may have a geographic or demographic logic, whereas products are typically organised according to a functional logic, and technology according to knowledge disciplines. Animated strategy cube, powered by Nolojy.
The distinction between global and local reference points is important, with a single external global viewpoint and set of taxonomies, enabling multiple local views with the roadmap configured accordingly. For example, product managers will require different views and structures to those of technology managers, and a roadmap configured for supply chain management will be different to one aimed at organisational development, whereas a CEO or investor may prefer the global reference point. Fig (b) above represents a local frame of reference pinned to the meso level, with the strategic focus associated with the central block in the strategy cube.
The strategy cube provides a framework for strategic situational awareness, reminding us to consider what is to the ‘left and right’ (i.e. how other functions in the organisation are related, for alignment of commercial and technical decisions and actions in a new car product development, for example), ‘above and below’ (e.g. how the strategic plan for a new car aligns with wider transport infrastructure developments, and is impacted by supplier component developments), and temporal aspects of these (i.e. strengths and weakness, legacy issues and path dependencies, together with future aspirations, opportunities and threats). These factors define pull & push forces that act the system in different ways along the three key dimensions of strategy, as illustrated in Fig (c) below.

The particular factors that affect the organisation, together with strategic actions and decisions, are depicted as a network of connected objects on roadmaps, and it is helpful to consider these connections and dependencies according to the three fundamental dimensions, as illustrated in Fig (d) above. Finally, development of coherent roadmaps involves narrative synthesis. A roadmap is a ‘picture that tells a story’, and the communication requirements for a roadmap influence the structure and process for its creation. As shown in Fig (e) above, thinking about narrative coherence along the three fundamental dimensions can be helpful, to ensure strategic plans link up horizontally and vertically in the system, and over time.
Depicting time in roadmaps
The time axis can be adjusted relatively easily, with some thought as to the rate of change in and of the system. There are no prescriptive rules, but often a roadmap might extend forward to at least two innovation cycles. The time frames considered in the roadmap will relate to the rate of change in the system - long term for software might be 2 years, while for transport it can be decades. For many industrial applications 1 ('budget'), 3 ('strategy') and 10 year ('vision') timeframes work well.
Care should be taken with the precision to which the roadmap is defined, as the future is uncertain (of course). Often short-, medium- and long-term epochs are sufficient, although sometimes it may be necessary to specify the first year down to the month. It's useful to include 'vision' on the right, to help set direction, and the past to capture current status and past experience (retrospective roadmapping).
Often a non-linear time scale is used, as there will be more knowledge of and interest in the short-term (actions and budgets), informed by the medium- and long-term, and vision (which is helpful as a direction setting 'beacon'). This pattern can be reversed if the intent and need is to focus on the long-term. At the very least, it is important to sequence content, even if actual dates or timeframes cannot be established.
Structuring the roadmap
The vertical axis, defining the multilayered structure of the roadmap, is more challenging. One of the confusions associated with roadmap design is that there are three iterative dimensions associated with strategy, with only two dimensions available to represent these in a 2D diagram (the roadmap). Of course, software is more flexible, allowing multiple views of the same underlying data, and dynamic configuration of the view to suit the context.
It is not critical to get the roadmap design perfect first time (good enough will do), as testing it with content through several iterations may be necessary to stabilise the structure and language. Also, remember that any diagram (including those on this page) is just a representation and not the underlying conceptual framework itself. When structuring a roadmap diagram one has choices about what to show, placement, and how much space and emphasis to give, based on judgements relating to purpose and context.
The underlying architectural elements that one considers as part of the design need not all be shown on the roadmap diagram - some may be implicit, used as organising principles but not explicitly depicted. Special interface layers may be be inserted for good reason - e.g. to highlight enablers and barriers to transferring new technologies to production. Wireframe diagrams using cartesian coordinates are widely used, essentially tabular in format, although there are other options - e.g. polar coordinates (transformation maps or 'sunshine charts'), and other tools and methods can be embedded or combined to create hybrid forms.
The deployed roadmap structure should 'fit the problem', which can only be demonstrated by 'stress testing' it with data (primary and/or secondary), to ensure that the 'canvas' or 'database structure' provided by the roadmap is suited to the kinds of discussion and decisions it is intended to support, and the context in which these occur.
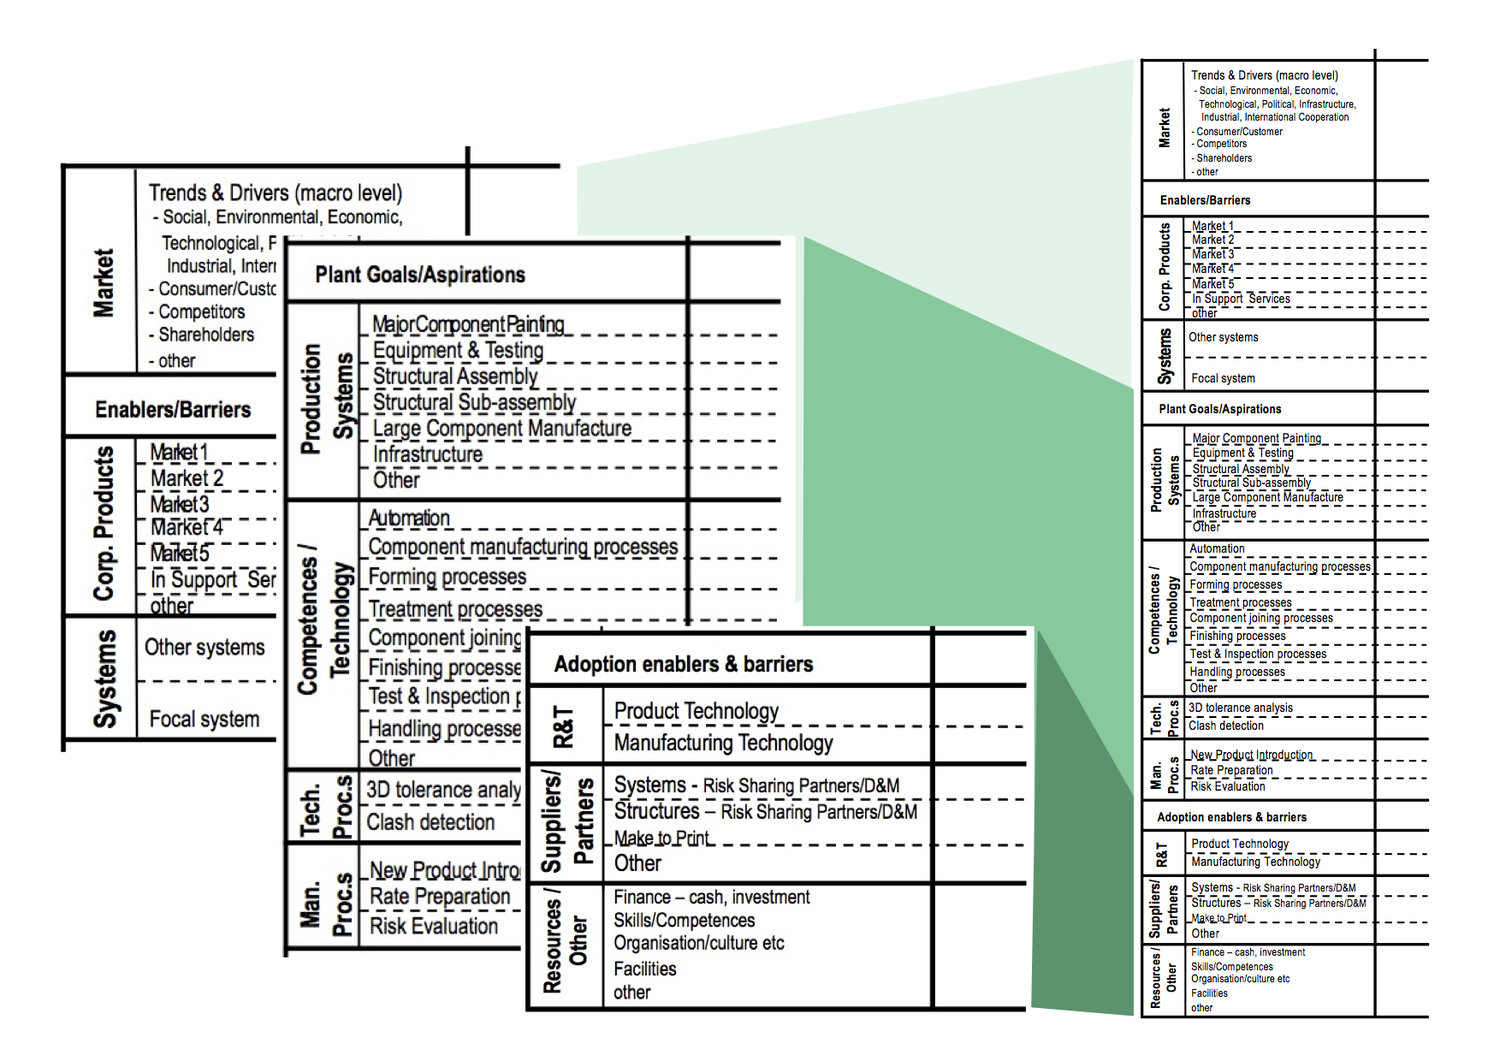
Roadmap architecture used for aerospace company, focusing on manufacturing of one key vehicle system (Phaal et al., 2010)
For endeavours of scale (businesses, large programmes) a family of roadmaps will be needed to allow horizontal and vertical alignment and synchronisation. It is helpful to ensure that the core narrative for each roadmap is clear, and aligned with those above and below in the hierarchy, with a common underlying architecture. This is an enterprise architecture consideration, and without this being clear large scale deployment of roadmapping is challenging. It not uncommon to find pockets of roadmapping practice in large firms, unaware of each other. It is rather easy to demonstrate the potential of the tool to support corporate alignment, but delivering it is another matter, requiring board-level support.

The systems-based architecture of roadmaps allows an hierarchical family of roadmaps to be developed, enabling aggregation and drill-down ('pan & zoom'), supporting vertical and horizontal alignment of strategy, process and toolkits

Sector level roadmapping workshop, focusing on a key 'landmark' identified in the 'landscape'
Bringing it together
Roadmapping is just one tool, and as with all management tools it has strengths and weaknesses. Thus, toolkits are needed, combining and configuring tools so that the strengths of one addresses the weaknesses of another. The holistic, integrative and flexible nature of roadmapping makes it the ideal integrating platform for toolkits.
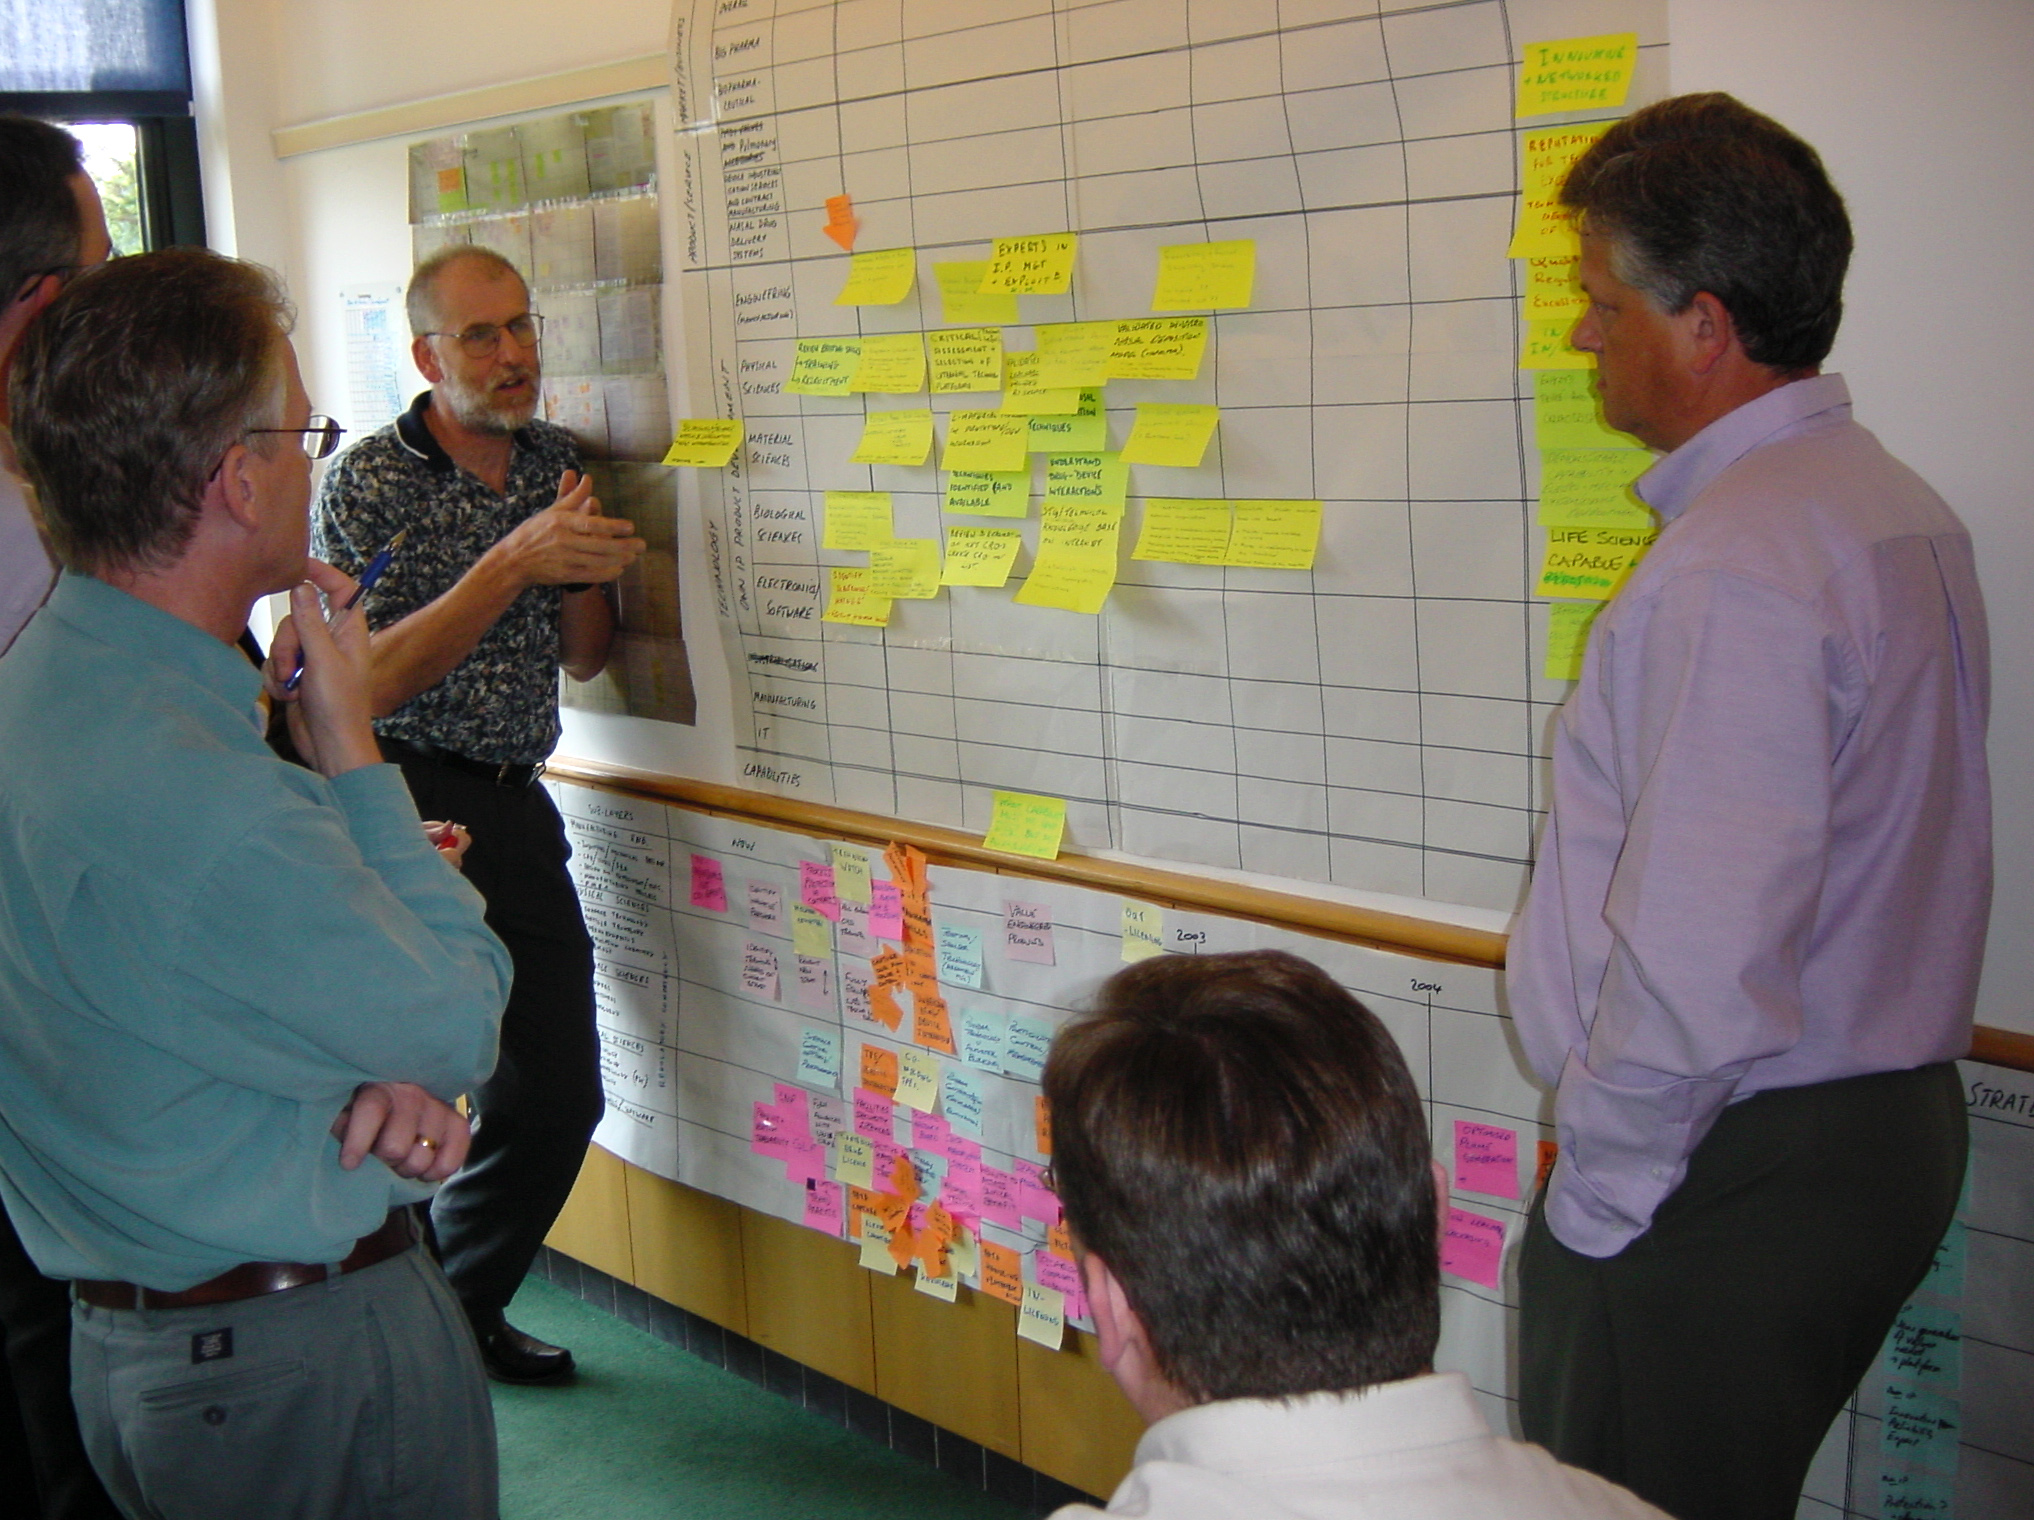
Second iteration, focusing on functional (production) strategy, with first-iteration inputs from other functions (digital composite top left, with first iteration production layer below, and other functional groups working in parallel in other small groups)
Roadmaps are ‘pictures that tell stories’, involving synthesis of knowledge, information and data to form coherent strategic narratives, organised according to the structural principles associated with roadmaps, as illustrated in the figure below. Initially in the process the focus is typically on gathering and organising information pertinent to the problem being addressed, from experts and through review of reports and other secondary sources. A lot of value at this stage relates to communication and insights associated with this process, with workshops often forming a key element of the process. However, an actionable evidence-based roadmap is unlikely to be produced immediately, with further work needed to gather more information, leading to more analysis, discussion and refinement. The quality of information during the first stage is likely to be variable, with low levels of stability and coherence. In addition, if all potentially relevant information is included and linked together then the complexity of the roadmap content is likely to be high, resulting in a lot of noise obscuring key messages, and challenges in maintaining the system, illustrated in Fig (a) below.

It should be recognised that there is a process to follow from the early use of roadmapping to the point where a stable and coherent roadmap is developed that is fit for purpose in terms of supporting strategic decisions. It is helpful to clearly separate the use of roadmapping for the earlier exploratory phases, which can assist directly with problem solving in a ‘sandbox’ mode, illustrated in Fig (a) above, and later stable curated roadmaps, illustrated in Fig (b). Different kinds of software support apply to each - for example, digital whiteboards can emulate paper & post-it note workshop methods, suitable for sandbox applications, whereas more structured roadmapping systems are suitable for curated systems. Such systems provide a useful resource for sandbox applications, but it is wise to manage the interface carefully, or risk corruption of the curated system with noise from exploratory activities.
The concept of a ‘backbone’ is recommended for roadmap synthesis, shown in red in Fig (b) above, which serves dual purposes of providing a top-level strategy summary of a roadmap, suitable for communication; and for linkage purposes, within and between roadmaps, hence localising connectivity and reducing complexity. The resulting network of information, overlaid on the structured roadmap canvas, is thus organised in a rather simple tree structure, with the dark blue elements in Fig (b) all connecting directly to the red backbone, and the light blue objects connecting to dark blue ones. This approach ensures that the detailed information needed to justify the overall strategic plan, and to implement it is not lost, which is often the case with simplified communication roadmaps, with the detail revealed when needed without necessarily obscuring the key messages.
Fig (b) above pins the backbone to the middle ‘what’ layer of the roadmap (e.g. product strategy), as this is often the core value-adding focus for organisations, meaningful to all, and reduces the information complexity of the roadmap (only one branch up and down, compared to roadmaps pinned to top or bottom layers). There is often a need for such roadmaps (e.g. technology- or market-focused roadmaps), and these will share data with each other and with product-focused roadmaps, so it is recommended that such supplementary roadmaps be created with reference to the core product roadmaps, to avoid duplication of data. In terms of backbone build sequence, it is recommended that a time horizon view of the portfolio be adopted - i.e. connect the why, what and how layers for the short, medium and long term sequentially, and then consider time-based and hierarchical narratives and associated connectivity.
The underlying 3x3 framework and associated data structures and content can be visually rendered in many ways depending on communication purpose, context and preference - as illustrated below. A process for visual design of roadmaps has been demonstrated for graphene (Nanoscale vol 7, no 11): Kerr, C. and Phaal, R. (2015), 'Visualising roadmaps: a design-driven approach', Research-Technology Management, 58 (4), pp. 45-54.
Roadmapping workshops are a useful part of strategy and innovation processes, but not sufficient - an immediate subsequent task is to transcribe the outputs to share with participants to confirm accuracy. Further work is needed to develop a presentable roadmap from the workshop and other sources in graphical format, and several roadmap formats may be required depending on audience and purpose. The above schematic examples are helpful for inspiration, as is an internet image search. At the early stages presenting roadmaps as drafts for comment is helpful for improving the roadmap and engaging stakeholders, as part of a wider consultation phase, and also to manage expectations - roadmaps can only ever be as good as the strategic thinking they convey, and are out of date as soon as created, as the world moves forward and events happen.
The product-technology roadmap example below was designed for detailed technical communication and programme management for an aerospace system (Type 1e), with key design features highlighted. It was created by the multidisciplinary programme team for this purpose, and is thus fairly complex in terms of structure and content. It was used as a resource for developing several simplified roadmaps in terms of format and content for senior management and broader dissemination.

Full-life aerospace systems roadmap (Type 1e), showing technology and product options for a new system, with roadmap design features annotated. Key content has edited for confidentiality reasons.
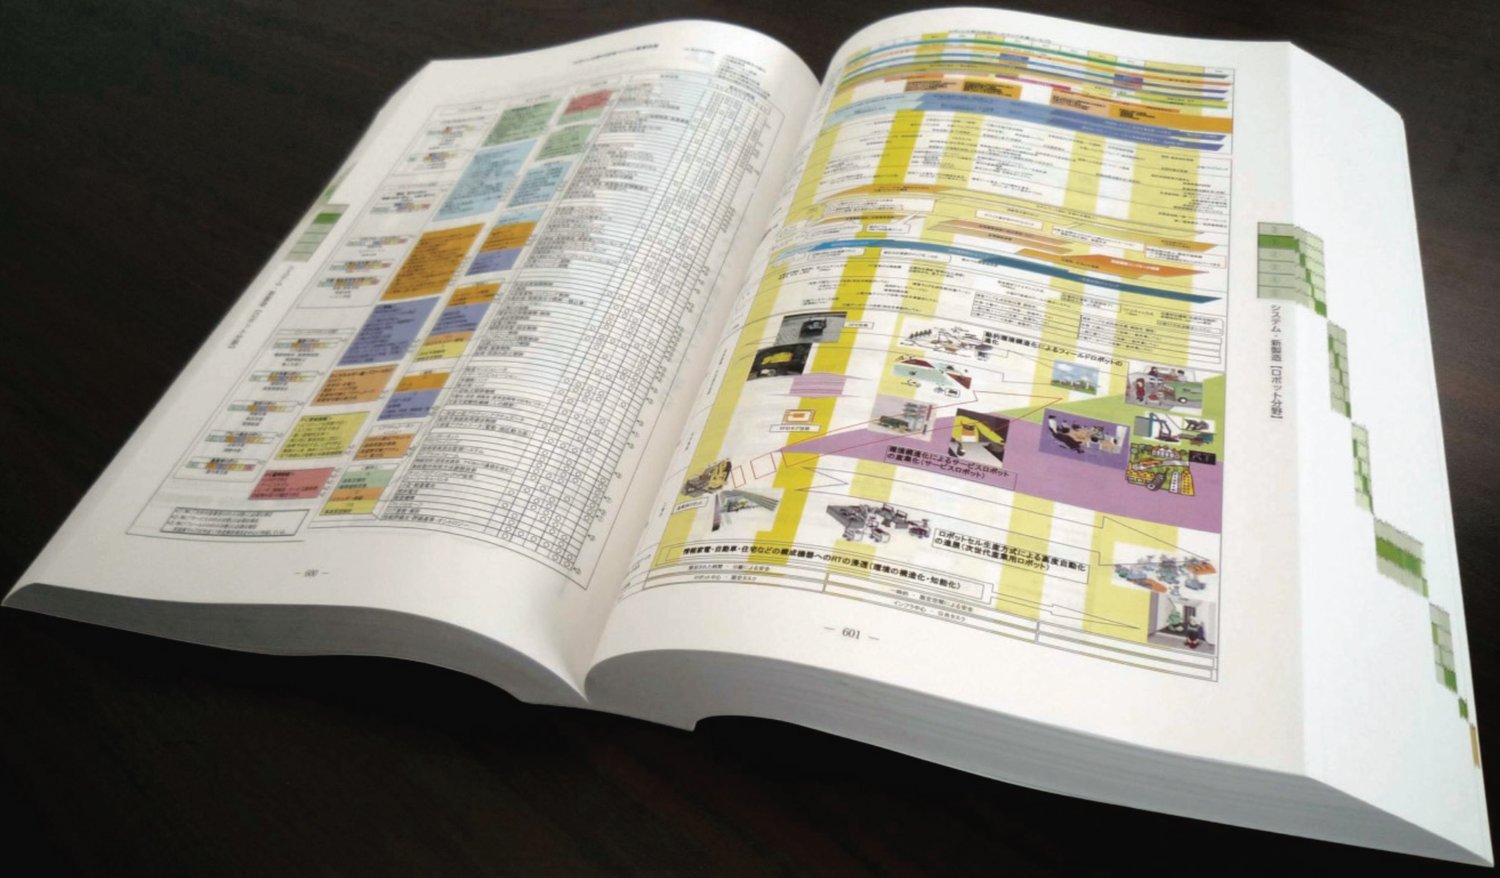
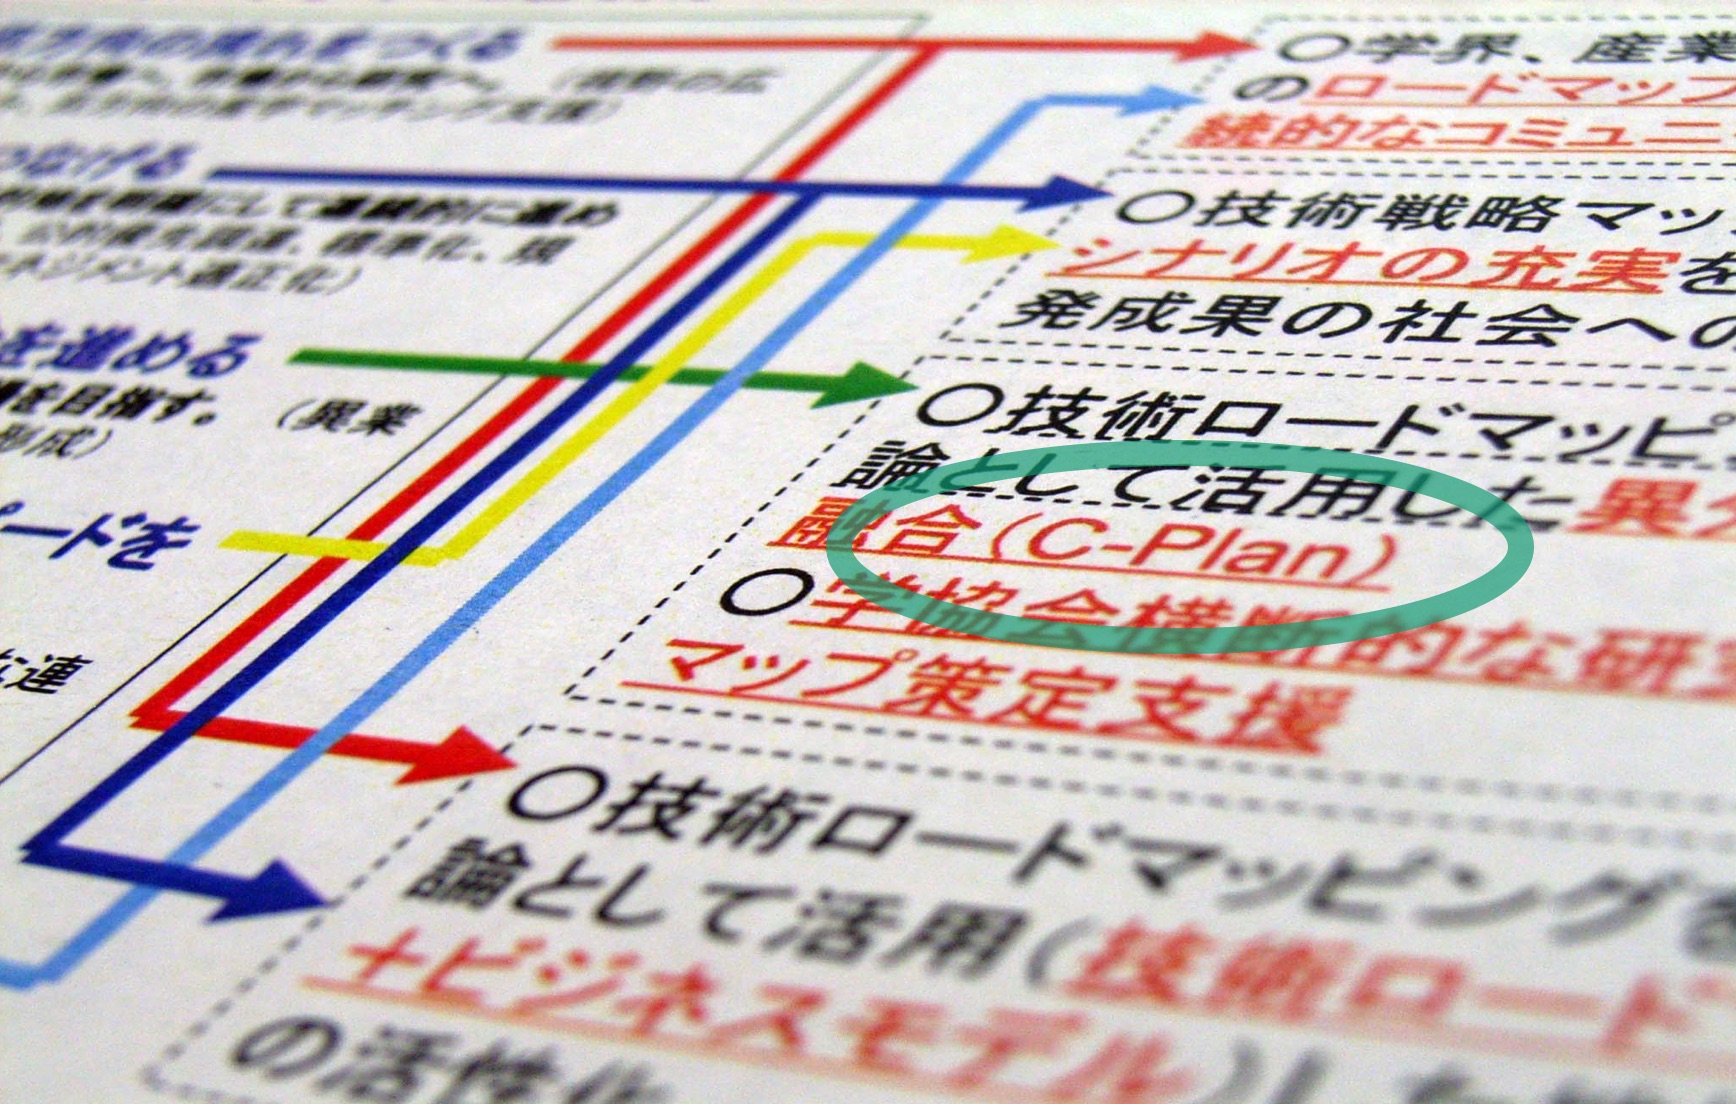
A consistent approach to roadmap and narrative structure can enable coherence at scale across a large system, as demonstrated by the Japanese Ministry of Economy, Trade and Industry (METI) - photos of 1,300 page roadmap document below (c2004). Twenty-five major areas of technology and their applications were mapping at the national level using a consistent style and structure, enabling intersections between technology domains to be explored in terms of technology convergence ('C-Plan' approach, inspired by T-Plan, which has been widely adopted and adapted around the world - for instance the long running & successful 'OTR' process and SME support activities from SimTech in Singapore).
Definition of ‘roadmap’
Building on the discussion above, the following general definition has been provided by Kerr & Phaal (2022), which is considered to encompass the key features of roadmaps:
A roadmap is “a structured visual chronology of strategic intent”
Other perspectives
If you have any queries regarding research, training, collaboration or other support please contact me at rob.phaal@eng.cam.ac.uk.